


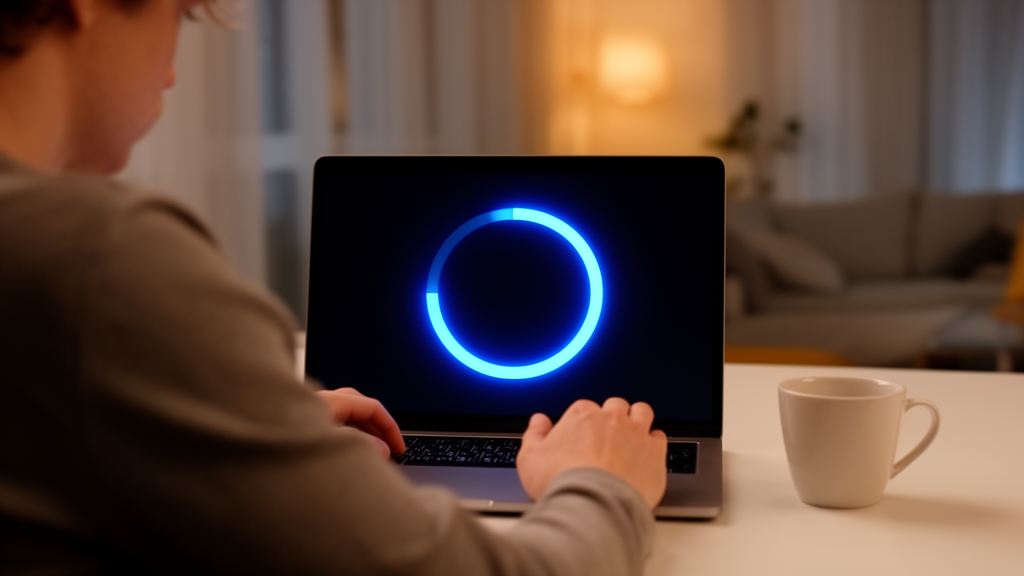
A circle beats a square when it comes to waiting. That is one of the central conclusions of a five-part experimental study published in Frontiers in Psychology, in which researchers from Hangzhou Dianzi University in China and Queen Mary University of London systematically tested how the visual design of progress indicators changes how long a wait feels and how it feels emotionally. Across the experiments, circular contours produced shorter duration estimates, higher ratings of perceived speed and more positive emotional responses than square contours, while the familiar choice between a bar-shaped and a circle-shaped indicator made no measurable difference at all. The findings suggest that the small graphical details of loading screens, often treated as decorative afterthoughts, can measurably distort a user’s sense of time.
Waiting is an unavoidable feature of human-computer interaction, and it carries real consequences. Prolonged waits can prompt users to close a webpage or abandon a transaction altogether. Informing users about loading progress has long been recognized as a way to reduce frustration and negative evaluations, and progress indicators are among the most common feedback designs in modern interfaces. Early work found that users prefer percentage indicators over static text prompts because real-time progress information reduces uncertainty and helps people manage their time. Later studies showed that graphical progress bars were preferred over static displays and looping animations. Because hardware constraints mean objective waiting time cannot simply be engineered away, designers have instead focused on subjective waiting time, which research indicates has a more significant impact on customer responses than clock time, and reducing time perception has been linked to improved user satisfaction.
To organize the many possible design choices, the team framed their investigation using conceptual metaphor theory, which holds that people understand abstract concepts through mappings onto familiar, concrete experiences. A progress bar, for example, maps an abstract computational task onto the idea of travelling along a straight path. The theory distinguishes three types of metaphor: structural metaphors, activated by features such as an icon’s shape or color form; orientational metaphors, tied to the direction of motion; and ontological metaphors, in which graphics simulate real-world objects or embodied experience. The researchers caution that visual representations are only sensory stimuli, and their enhancement effects do not necessarily activate metaphors, meaning that not every visual design method can be assumed to influence user perception without empirical verification.
The five experiments shared a common measurement approach. In each study, participants viewed loading interfaces as video stimuli and then estimated the duration of each trial, rated perceived speed on a seven-point scale from very slow to very fast, and reported their emotional responses using an adapted Self-Assessment Manikin, a widely used pictorial instrument with seven-point ratings for valence, arousal and dominance. The experiments used within-subject designs, meaning each participant experienced every condition, with order effects counterbalanced through AB/BA or Latin square arrangements. Stimuli were high-resolution videos displayed at 30 frames per second on a standard monitor, and loading times were held constant across conditions within each experiment, typically at seven seconds, so that any differences in response could be attributed to the visual design rather than actual duration.
The first experiment revisited the most basic design question: does the overall shape of the indicator matter? Twenty-three participants viewed a bar that progressed from left to right and a circle that rotated clockwise from the top, each filling over seven seconds. The results showed no significant differences between the two shapes in duration estimation, perceived speed or emotional ratings. The authors note this is consistent with previous research finding that simple geometric shapes produce similar time perception. They offer two possible explanations: the seven-second presentations may have been too short for participants to attend to shape at all, or progress circles are so common in everyday life, often accompanying unpleasant situations such as network latency and signal loss, that any inherent appeal of the curved form is offset by learned associations.
The second experiment shifted focus from dynamic shapes to static contours, which had received less attention in prior work. Twenty participants viewed container-type icons with identical internal fill animations and colors, differing only in whether the outer contour was circular or square, with icon areas matched to within 0.06 percent. Here the differences were striking and statistically robust. The circular contour yielded a mean duration estimate of 5.65 versus 7.05 for the square, a mean perceived-speed rating of 5.10 versus 3.75, and a mean emotional rating of 5.32 versus 4.32, all significant at p below 0.001. The authors suggest a perceptual illusion may have made the circular icon appear larger, implying a faster filling speed. The emotional advantage of curves aligns with earlier findings that people respond more favorably to circles than to polygons, and with the evolutionary-psychological observation that sharp contour changes are often associated with potential threats, whereas curved objects evoke pleasure and affinity.
The third experiment examined color form, testing whether a structural metaphor expressed through color could influence perception. Nineteen participants viewed a circular container icon rendered either in static color or with progressive transparency, in which the fill changed from completely transparent to completely opaque as the loading process advanced over ten seconds. Duration estimates and emotional ratings did not differ significantly between the two forms, but perceived speed did: progressive transparency produced significantly faster perceived speed than static color. The authors interpret this through the attentional gate model, which proposes an internal pacemaker whose pulses pass through a gate whose opening is influenced by attention to time. Continuous updates to transparency, they argue, repeatedly capture attention and divert it away from temporal information, shrinking the gate opening and shortening perceived time, whereas static color quickly loses its attentional pull.
The fourth experiment, the largest with 43 participants, tested four motion directions for a progress bar: left to right, right to left, bottom to top, and top to bottom, arranged in a 4 by 4 Latin square design. Motion direction significantly affected duration estimation and perceived speed. Top-to-bottom motion was associated with longer duration estimates and lower perceived-speed ratings than right-to-left and bottom-to-top motion. The authors invoke symbolic speed theory as one possible explanation: when motion implies greater speed, users may perceive time as passing more slowly, so the perceived speed of vertical descent may distort time judgment even when loading duration is held constant. The emotional main effect of direction was statistically significant, but the pairwise contrast between bottom-to-top and top-to-bottom motion did not remain significant after Bonferroni correction, a caution the authors preserve in their reporting.
The fifth experiment tested concretization, the treatment of an abstract concept as a physical entity, by comparing a container icon filled up to a plain straight line against one whose fill boundary simulated flowing water. Twenty participants viewed both versions, which had identical contours, areas and colors. The water-like design produced significantly faster perceived-speed ratings and significantly more positive emotional evaluations, but did not change duration estimates. The authors suggest the identical contour shapes allowed participants to quickly estimate the remaining fill distance, so the changing graphic did not distort time perception. They also warn against assuming that greater visual complexity always shortens perceived time, citing the storage size model, in which more information processed within a target duration increases time estimation, meaning elaborate designs could impose excessive processing demands.
Taken together, the studies show that the effects of progress-indicator design vary across outcome measures: visual features that shorten perceived duration do not necessarily improve emotional responses, and vice versa. The authors derive practical recommendations, suggesting designers consider circular contours where they fit the interface context, use progressive transparency changes to communicate loading progress, avoid top-to-bottom motion where possible, and employ concrete visual cues while keeping displays simple. They also acknowledge limitations: the experiments tested only progress bars and circles rather than the wider variety of contemporary styles, did not examine specific color variations in detail, and required participants to experience loading interfaces directly without simulated everyday use scenarios, which differs from real-world computer use. Future work, they write, could address these gaps by broadening the stimulus set and embedding loading tasks in realistic contexts.
Subject of Research: How the visual design of progress indicators shapes users' time perception and emotions during waiting
Article Title: The effects of visual design of progress indicators on time perception and emotion
Article References: Luo, Y., Guo, Y., Wang, D., Zhao, Y., & Lou, X. (2026). The effects of visual design of progress indicators on time perception and emotion. Frontiers in Psychology, 17, Article 1977311. https://doi.org/10.3389/fpsyg.2026.1977311
Image Credits: AI Generated
DOI: 10.3389/fpsyg.2026.1977311
Keywords: progress indicators, time perception, user experience, conceptual metaphor theory, human-computer interaction, visual design, attentional gate model, waiting time, emotion, interface design, perception science, loading animations
Cite Scienmag News
Glenn Wilkins. (October 24, 2026). Round Progress Bars Make Waits Feel Shorter, Five Experiments Show. Scienmag. https://scienmag.com/round-progress-bars-make-waits-feel-shorter-five-experiments-show/
Glenn Wilkins. "Round Progress Bars Make Waits Feel Shorter, Five Experiments Show." Scienmag, 24 October 2026, https://scienmag.com/round-progress-bars-make-waits-feel-shorter-five-experiments-show/. Accessed 24 October 2026.
Glenn Wilkins. "Round Progress Bars Make Waits Feel Shorter, Five Experiments Show." Scienmag. October 24, 2026. https://scienmag.com/round-progress-bars-make-waits-feel-shorter-five-experiments-show/


