

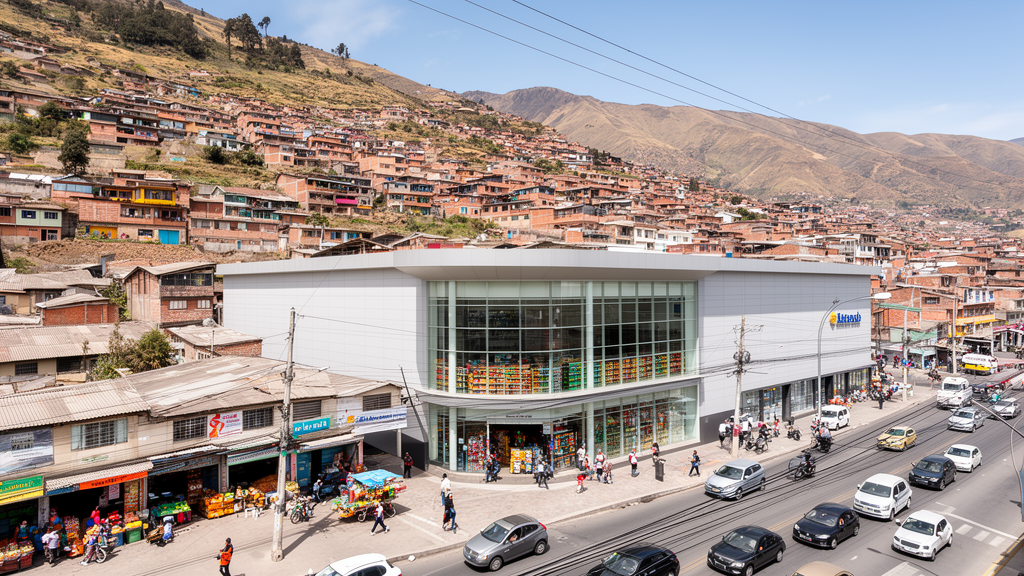
A cross-sectional geospatial study found that chain supermarkets made up 78.4% of 218 mapped food-supply facilities in Quito, Ecuador, while municipal markets and agroecological farmers’ fairs together accounted for 21.6%. Supermarkets were concentrated along the capital’s central-northern axis, and their density was about 28 times higher in the highest land-value areas than in the lowest. The researchers described the pattern as geographical inequality within the three supply channels studied, while cautioning that it does not represent Quito’s entire food system or demonstrate individual access to food.
The study examined chain supermarkets, municipal food markets and agroecological fairs across the urban portion of the Metropolitan District of Quito. It used georeferenced information from official and institutional databases, including the 2022 national census and geostatistical framework, municipal records and an agroecological-fairs database. Locations were geocoded in the final quarter of 2025 and organized in a regular hexagonal grid with 500-meter sides, clipped to the urban mask. The researchers then calculated outlet density, availability relative to estimated population and a Supermarket Dominance Index showing the share of mapped outlets represented by chain supermarkets in each grid cell or zonal administration.
Population estimates for the 413 analytical units were produced by an area-weighted interpolation of census-sector data. Where a hexagonal cell intersected more than one census sector, the population fractions were added to produce an estimated resident total. The approach aligned the population denominator with the same grid used to count facilities, allowing comparisons of supermarkets and associative facilities per square kilometer and per 10,000 inhabitants. The density calculations used each hexagon’s effective urban area, an approach intended to reduce distortions from irregular administrative boundaries and to avoid including non-residential or non-urbanized land.
Among the mapped facilities, supermarkets outnumbered municipal markets and agroecological fairs by approximately 3.6 to one. Municipal markets constituted 76.6% of the combined associative facilities, while fairs made up 23.4%. The largest supermarket concentration occurred in the northern and central parishes of Iñaquito, Mariscal Sucre, La Concepción, Kennedy and San Isidro del Inca. Six chain and retail formats were represented in the map: TuTi, Supermaxi, TÍA, Santa María, AKÍ and Mi Comisariato. TuTi had the broadest distribution, extending from Calderón in the north to Guamaní and Turubamba in the south, although it remained most concentrated in the north-central corridor.
Municipal markets followed a different geography. They were most visible in historically consolidated popular districts such as Centro Histórico, La Magdalena, Chimbacalle and San Bartolo, and their presence weakened toward parts of the northern periphery and the eastern valleys. The researchers also identified low or absent municipal-market coverage in large southern and peri-urban residential areas, including La Ecuatoriana, Turubamba, Guamaní and Chillogallo, even though smaller supermarket formats were present in some of those locations. Agroecological fairs formed an even smaller and more dispersed network, appearing in five of the six zonal administrations but with no registered location in Manuela Sáenz.
Supermarkets remained the largest category in every zonal administration, accounting for between 68.0% of mapped outlets in Manuela Sáenz and 82.3% in Eugenio Espejo. The Supermarket Dominance Index was highest in Eugenio Espejo, at 0.82, and La Delicia, at 0.81, followed by Eloy Alfaro and Quitumbe, both at 0.79. La Mariscal recorded 0.74, and Manuela Sáenz had the lowest value, 0.68, reflecting the comparatively larger contribution of municipal markets there. This index describes only the numerical composition of the three mapped categories; it does not measure sales, consumer dependence, corporate power, profitability or displacement of other forms of commerce.
Population-adjusted results reinforced the numerical asymmetry. La Mariscal had the highest density for both channels, with 2.63 corporate and 0.93 associative outlets per 10,000 inhabitants, followed by Eugenio Espejo, with 1.54 and 0.33, respectively. Corporate density was 0.86 in Manuela Sáenz, 0.83 in La Delicia, 0.81 in Eloy Alfaro and 0.61 in Quitumbe. Associative density was highest after La Mariscal in Manuela Sáenz, at 0.40, followed by Eugenio Espejo at 0.33, Eloy Alfaro at 0.22, La Delicia at 0.19 and Quitumbe at 0.16. These measures describe relative territorial availability, not practical accessibility, because the analysis did not include travel time, transport links, mobility, household purchasing power or other barriers faced by individual consumers.
The clearest gradient appeared when facilities were compared with official land values, which the researchers used as a contextual proxy for spatial socioeconomic differentiation because no household-status index was available at the required resolution. Supermarket density rose from 0.060 outlets per square kilometer in the lowest-value quintile to 1.662 in the highest, while the share of hexagons containing at least one supermarket increased from 1.2% to 55.4%. Land value was positively associated with supermarket density, with Spearman’s rho of 0.482 and p below 0.001. A Kruskal–Wallis test also found significant differences among quintiles, and post-hoc comparisons distinguished the three lower-value groups from the two higher-value groups. The authors stressed that land value is not a direct measure of residents’ income or purchasing power.
Associative outlets showed a weaker and less consistent relationship with land value. None was recorded in the lowest-value quintile. Their density was 0.160 outlets per square kilometer in the second quintile, fell to 0.087 in the third, and rose to 0.338 and 0.405 in the fourth and fifth. The proportion of hexagons containing an associative facility was 0%, 7.3%, 4.8%, 19.5% and 19.3% across the five groups. Despite these fluctuations, land value had a positive association with associative density, with Spearman’s rho of 0.239 and p below 0.001, but the overall pattern was substantially less pronounced than for supermarkets. Both kinds of infrastructure were therefore more frequently present in higher-value areas, although the concentration was much stronger for corporate chains.
The authors interpret the mapped pattern as a form of asymmetric territorial organization, noting that it cannot by itself establish causes such as oligopoly, segregation, price effects or changes in food choices. Important gaps include independent supermarkets, small family-owned stores, other retailers and prepared-food businesses, as well as data on sales, prices, supply capacity, operating frequency, product diversity and customers served. The snapshot also cannot show whether the distribution changed over time or whether residents can reach outlets. Its principal value is therefore a reproducible baseline for future assessment: periodic updates could track chain expansion, market continuity and the evolution of fairs, while later studies could add mobility, travel times, socioeconomic conditions, consumer behavior and monetary flows. The findings provide a spatial inventory for further urban food planning without, on their own, establishing the effects of any particular policy.
Subject of Research: Spatial inequalities among supermarkets, municipal markets and agroecological fairs in Quito, Ecuador
Article Title: Geographical inequalities in Quito’s food supply: expressing the corporate, public, and associative forms
Article References: Izurieta-Guevara, M., Báez-Agama, E., Lozano-Erazo, E., Villalba-Vásquez, J. J., Pérez-Tapia, L. V., Hoyos, D. P., & Pérez-Tasigchana, F. (2026). Geographical inequalities in Quito’s food supply: expressing the corporate, public, and associative forms. Frontiers in Sustainable Cities, 8, 1932258. https://doi.org/10.3389/frsc.2026.1932258
Image Credits: AI Generated
DOI: 10.3389/frsc.2026.1932258
Keywords: urban food systems, Quito, geospatial analysis, food access, supermarket concentration, municipal markets, agroecological fairs, spatial inequality, urban planning, Ecuador, Geographical, inequalities
Cite Scienmag News
Scienmag. (October 22, 2026). Supermarkets dominate Quito’s unevenly distributed food infrastructure. https://scienmag.com/supermarkets-dominate-quitos-unevenly-distributed-food-infrastructure/
Scienmag. "Supermarkets dominate Quito’s unevenly distributed food infrastructure." Scienmag, 22 October 2026, https://scienmag.com/supermarkets-dominate-quitos-unevenly-distributed-food-infrastructure/. Accessed 22 October 2026.
Scienmag. "Supermarkets dominate Quito’s unevenly distributed food infrastructure." Scienmag. October 22, 2026. https://scienmag.com/supermarkets-dominate-quitos-unevenly-distributed-food-infrastructure/


