


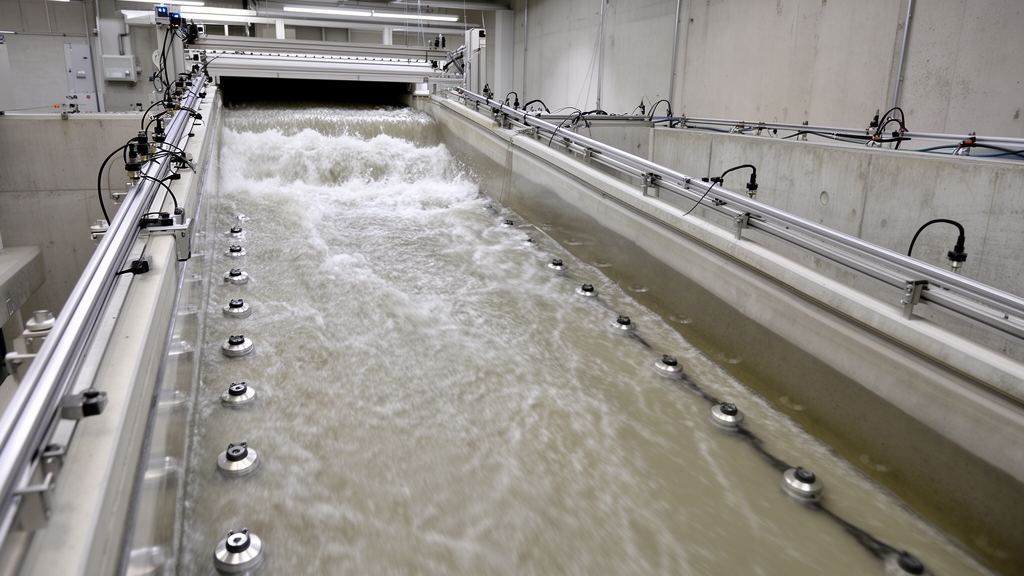
Large-scale laboratory experiments found that upstream water depth and bed slope increased the peak pressure exerted by a dam-break wave against a vertical wall, while a longer downstream channel reduced it. The study examined 256 experimental conditions covering different water depths, slopes and channel lengths, with each condition tested three times. Fifteen high-frequency pressure sensors and high-definition video recorded the impact of both bore and undular waves. The results provide experimental relationships for estimating peak wall pressure, maximum impact force per unit width and maximum run-up height, although they apply to rigid walls and simplified channel geometry rather than natural floodplains.
The experiments used a 70 m long, 1.2 m wide and 1.0 m deep rectangular flume. Its bed slope could be set to 0, 2, 4 or 6 per thousand, with the authors describing these gradients as representative of mountainous rivers. Upstream water depths ranged from 0.5 to 0.8 m, downstream depths from 0.1 to 0.4 m, and downstream channel lengths from 20 to 50 m. A rapidly lifted gate produced an effectively instantaneous dam break, while a 0.9 m high tailgate served as the vertical wall. The ratio of downstream to upstream depth, denoted by alpha, was used to compare wave regimes.
Measurement reliability was checked before the pressure results were interpreted. Video-derived water levels were compared with a wave gauge positioned 1 m in front of the wall. The maximum relative error was 7.66%, and the root mean square error was 0.89%. Comparisons with eight independently set water depths produced a maximum absolute relative error of 3.3%, also with an RMSE of 0.89%. The flume frame, fixed vertical rods and a 0.5 m calibration scale were used to correct perspective and geometric distortion. Repeated pressure records at selected sensors produced relatively small RMSE values and consistent temporal patterns, supporting repeatability, although air-water mixtures and discrete sensor sampling added uncertainty to derived impact forces.
The researchers classified the incoming waves using a global Froude number, with values below 1.23 indicating an undular wave, values above 1.23 indicating a bore wave and 1.23 marking the transition. Bore-wave impacts followed three stages. The initial impact produced rapid, high-amplitude pressure oscillations as an aerated wave front struck the wall and climbed it as a rolling splash. The quasi-steady phase included smaller oscillations as reflected, air-rich water interacted with the main flow. During the decay phase, the water level fell and the pressure signal became comparatively smooth. Sensor response began progressively later at higher positions, and peak pressure generally decreased with elevation.
Downstream channel length had a measurable effect on the impact. In one bore-wave case, increasing the channel length from 20 to 50 m reduced peak pressure at measurement point P8 from 5.43 to 3.48 kPa, a 35.91% reduction. This case had an upstream depth of 0.8 m and increased discharge relative to the other examples, and the reduction was therefore most pronounced in that higher-flow condition. Pressure was not uniform across the wall: its horizontal distribution showed nonlinear variation, and pressure at the same horizontal position increased as upstream depth rose. Lower sensors encountered the wave first and captured a greater dynamic contribution, while upper sensors were more affected by the later rise of the water level.
The effect of the water-depth ratio differed between the two wave forms. Under bore-wave conditions, peak pressure decreased as alpha increased. For 0.1 < alpha ≤ 0.2, the normalized peak pressure, Pmax divided by rho g h sub u, showed an approximately linear decline with alpha. A least-squares relationship produced coefficients of determination from 0.86 to 0.99 and included 95% confidence and prediction intervals. Its applicability was nevertheless narrow: all tests in that interval used a downstream depth of 0.1 m, so alpha varied mainly because the upstream depth changed from 0.5 to 0.8 m. The result should not be treated as a universal linear law for all bore-wave conditions.
Under undular-wave conditions, the relationship was non-monotonic. As alpha increased from 0.43 to 0.80, peak pressure first increased and then decreased, reaching its maximum near alpha = 0.57. The authors associated this behavior with particularly strong wave fluctuation and a high wave height near that ratio. The pressure history also differed from that of a bore wave. The initial impact drove water rapidly up the wall to its maximum height, after which nearly cosine-like oscillations occurred. Successive pressure maxima decayed as surge energy dissipated, and the oscillation period shortened. Some runs displayed a double peak in which pressure rose to an initial maximum, dipped slightly and then reached a secondary maximum before falling abruptly. Video showed water overtopping the wall, spilling downstream while another portion overturned and moved upstream.
A height-dependent exponential model described the decaying maxima during the relative fluctuation phase. The model used nondimensionalized pressure, Pm divided by rho g h sub u, and nondimensionalized time, t divided by the square root of h sub u divided by g. Fits at different sensor heights produced coefficients of determination from 0.96 to 0.98, while the reported confidence and prediction intervals represented uncertainty in the fitted relationships and expected ranges for new observations. The coefficient expressing decay became stronger at greater heights, indicating faster attenuation higher on the wall. Application of the relationship nevertheless required an accurately determined first peak pressure, and the highest analyzed sensor at z divided by D = 0.778 produced no distinct response in most cases.
For bore waves, the team derived a model for maximum impact force per unit wall width by combining mass conservation with one-dimensional momentum flux. The formulation incorporated bed slope, incident wave velocity, reflected-flow behavior and hydraulic depths near the wall, rather than treating the pressure trace as the force itself. Incident velocity was estimated using a wet-bed hydraulic-jump expression, while video measurements provided water levels within 1 m of the wall. Because total impact force was not measured directly, comparison values were obtained by vertically integrating pressures recorded at five sensors along the wall centerline. At a bed slope of 2 per thousand, model errors were generally within 20%, and the calculation reproduced the observed trend in maximum force. Sparse vertical sampling, errors in incident velocity and strongly aerated flow could reduce accuracy.
A separate simplified engineering model estimated maximum run-up height from a Bernoulli-based energy relation. Video observations were used to calculate an energy-retention coefficient, most values of which fell between 0.6 and 1; the overall mean was 0.80, and average values differed little among the four tested slopes. Combining this coefficient with the incident-wave velocity expression produced the run-up equation. When compared with experimental data from earlier work, the calculated values had relative errors below 18%. The equation was calibrated for global Froude numbers from 0.50 to 2.65 and tested over 0.78 to 4.24, so part of its performance involved extrapolation beyond the calibration range. The authors caution that intense breaking, pronounced air entrainment, strong flow separation or severe overtopping may reduce its reliability.
Across the tested conditions, greater upstream depth and bed slope increased peak wall pressure, whereas greater downstream length reduced it. The dependence on water-depth ratio also changed with wave regime: it was inverse under bore-wave conditions but non-monotonic under undular conditions, with a maximum near alpha = 0.57. Together, the pressure, force and run-up models offer quantitative tools for analyzing dam-break impacts on wet sloping beds. Their direct scope is limited to water-depth ratios of approximately 0.13 to 0.80, rigid vertical walls, bed slopes of 0 to 6 per thousand and the tested flume dimensions. Bed friction, irregular boundaries, realistic topography and other natural channel features were not represented, so the results should be applied outside those conditions only with caution.
Subject of Research: Laboratory measurement and modeling of dam-break wave pressure, force and run-up on sloping wet beds
Article Title: Experimental investigation of impact pressure characteristics and predictive models for dam-break waves over a sloping wet bed
Article References: Yuan, H., Liu, S., Zhou, X., Sun, Q., Mao, Y., & Hu, R. (2026). Experimental investigation of impact pressure characteristics and predictive models for dam-break waves over a sloping wet bed. Frontiers in Marine Science, 13, Article 1974638. https://doi.org/10.3389/fmars.2026.1974638
Image Credits: AI Generated
DOI: 10.3389/fmars.2026.1974638
Keywords: dam-break waves, impact pressure, wet-bed flows, bed slope, flume experiments, bore waves, undular waves, impact force, run-up modeling, hydraulic engineering, Experimental, investigation
Cite Scienmag News
Violet Maxwell. (October 22, 2026). Flume study quantifies dam-break pressure on sloping wet beds. Scienmag. https://scienmag.com/flume-study-quantifies-dam-break-pressure-on-sloping-wet-beds/
Violet Maxwell. "Flume study quantifies dam-break pressure on sloping wet beds." Scienmag, 22 October 2026, https://scienmag.com/flume-study-quantifies-dam-break-pressure-on-sloping-wet-beds/. Accessed 22 October 2026.
Violet Maxwell. "Flume study quantifies dam-break pressure on sloping wet beds." Scienmag. October 22, 2026. https://scienmag.com/flume-study-quantifies-dam-break-pressure-on-sloping-wet-beds/


