


Reflectance spectroscopy combined with standard normal variate preprocessing and partial least squares discriminant analysis separated tomato leaves collected at seven stages of Tomato brown rugose fruit virus infection more effectively than absorbance measurements in a controlled greenhouse experiment. The study followed 27 inoculated tomato plants from 1 to 7 days post-inoculation, recording visible and near-infrared spectra from three leaves per plant at each sampling day. Reflectance models achieved perfect classification within the internal training and cross-validation data after standard normal variate, or SNV, correction, while the best absorbance model reached an F1-score of 0.9482. This was a classification study of infection stage rather than a direct test of infected versus healthy leaves, and its feature-selection procedure prevented the internal performance figures from being fully independent estimates of generalization.
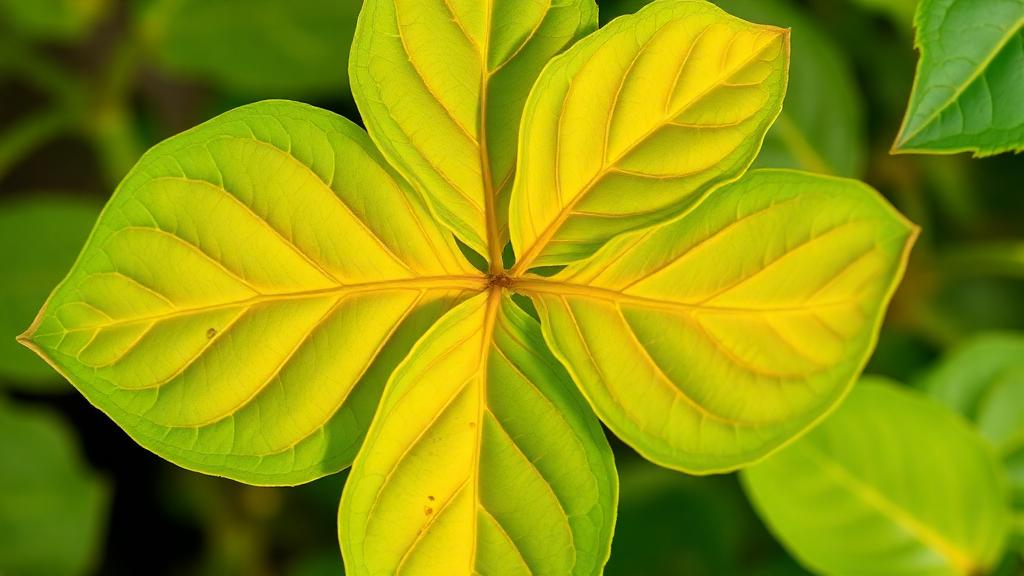
The experiment used Moneymaker tomato plants grown in pots at 25 ± 2 °C under a 16-hour-light, eight-hour-dark cycle. A characterized ToBRFV isolate was mechanically introduced into young leaves, and the plants were then maintained in an insect-free greenhouse. Spectral measurements began 24 hours after inoculation and continued on each of the next six days. Progressive chlorosis and curling were visually documented from day 3 onward, but the researchers did not include a separate healthy or mock-inoculated group. Accordingly, the seven classes in the analysis represented days after inoculation, not infection versus no infection. This design limits the study’s ability to determine when a plant first becomes spectrally distinguishable from an uninfected control.
For each plant and sampling day, investigators measured three young, actively growing leaves, avoiding major veins. Three positions were assessed on each leaf, and three consecutive scans at each position were averaged, producing one representative spectrum per leaf. This yielded 81 leaf-level spectra per day for both optical modes. All three spectra from a given plant remained within the same training or test partition during data splitting, preventing measurements of the same individual from leaking across partitions. A later external-validation campaign included approximately seven additional plants at each of the seven days, but it was conducted under the same greenhouse and instrumental setup rather than as an independent biological trial involving a different growth batch, season or facility.
Measurements were made with a portable Apogee PS-100 spectrometer operating over a nominal 350–1100 nm range, although the analysis was restricted to 400–1100 nm because detector-edge pixels were noisy. A tungsten–halogen source, fiber-optic probe and approximately 5 mm working distance were used, with leaves supported on a matte, non-reflective surface. Before each session, the instrument received white-reference and dark-reference calibration. Measurements were performed at 20 ± 2 °C with automatic exposure settings; no fixed integration time was recorded. The instrument generated reflectance and absorbance outputs directly, with reflectance expressed in raw digital counts and absorbance in the instrument’s native units rather than calculated from reflectance after acquisition.
Mean spectra revealed time-dependent differences in the visible region, the red edge at about 700–750 nm and the near-infrared region from 750–1100 nm. Absorbance around the chlorophyll-associated feature near 680 nm was generally higher at later sampling days, while the red edge showed changes in slope and position. In the near infrared, absorbance rose at intermediate stages before declining at days 6 and 7, producing a nonlinear pattern across the experimental period. Reflectance also varied nonlinearly, including an anomalously high day-6 signal and a partial decrease or recovery the following day. These observations suggest a multiphase response, but the researchers measured no independent chlorophyll, carotenoid, water-content, anatomical or viral-load variables, so the proposed physiological causes remain plausible interpretations rather than demonstrated mechanisms.
The red edge was identified as a particularly sensitive domain for tracking gradual change, with the near-infrared region providing complementary information associated with leaf structure and water status. In PLS-DA score plots, raw spectra showed partial separation between early and late classes but overlap among intermediate days, together with a curved or horseshoe-like structure in absorbance data. SNV produced a more organized representation, and SNV-treated reflectance formed a smooth temporal trajectory from day 1 through day 7. The most absorbance-model errors occurred between adjacent days, especially days 4–5 and 5–6, consistent with a soft boundary between consecutive stages. Day 6 was the most uncertain absorbance class, whereas day 7 was the most consistently separated. The plots therefore suggest that the spectral response changes progressively rather than as seven discrete states, even where a supervised classifier assigns each observation to a specific day.
Reflectance consistently outperformed absorbance in the internal training and cross-validation assessment. With raw spectra, the reflectance model produced precision of 0.9905, recall of 0.9890, specificity of 0.9980 and an F1-score of 0.9894, compared with 0.9457, 0.9355, 0.9903 and 0.9383 for raw absorbance. SNV raised the absorbance F1-score to 0.9482 but produced perfect precision, recall, specificity and F1 values for reflectance. Savitzky–Golay filtering alone reduced the absorbance F1-score to 0.8967, while leaving the reflectance score unchanged at 0.9894. Combining SNV with Savitzky–Golay filtering reduced absorbance performance to an F1-score of 0.9177 but retained perfect reflectance metrics. The comparison indicates that normalization was more useful than smoothing in this dataset and that additional smoothing after SNV did not provide a measurable gain.
Those perfect reflectance results require careful interpretation. Wavelength selection was performed on the full dataset before the cross-validation and test partitions were evaluated, rather than being repeated independently within each training fold. The model therefore had access to spectral variables selected with information from samples that later appeared in validation sets. The reported F1-score of 1.000 should consequently be treated as an internal upper-bound estimate rather than a fully unbiased measure of performance on new plants. The study also did not provide a tabulated, ranked list of retained wavelengths or their coefficient and variable-importance-in-projection values, so the attribution of discrimination to specific red-edge and near-infrared bands remains qualitative. Visualized external-validation points include predictions on both sides of the classification threshold, reinforcing that perfect internal separation did not translate into perfect performance for the later acquisition campaign.
The experiment offers a technically detailed demonstration that reflectance spectra can encode temporal changes in ToBRFV-inoculated tomato leaves under controlled conditions, but it does not yet establish a field-ready diagnostic test for the virus. The strongest internal results came from SNV-corrected reflectance, while absorbance remained useful but less consistent, particularly around intermediate stages. The absence of same-day healthy controls means the reported classes document progression among inoculated plants rather than the onset of detectable infection. Fully nested validation, independent biological batches, direct reference measurements of plant chemistry and structure, and testing under changing field conditions would be needed before the method could support conclusions about pre-symptomatic detection or practical crop-health assessment. Within the present scope, the results identify a promising spectral-modeling strategy and a clear dependence of classification performance on both optical mode and preprocessing.
Subject of Research: Experimental comparison of reflectance and absorbance spectroscopy for classifying early ToBRFV infection stages in tomato leaves
Article Title: Temporal reflectance and absorbance spectral signatures of ToBRFV-infected tomato leaves: a PLS-DA modeling comparison over a 1–7-day post-inoculation period
Article References: Pourdarbani, R., Sabzi, S., Torshizi, M. V., Pouresmaeil, M., & Saadati, N. (2026). Temporal reflectance and absorbance spectral signatures of ToBRFV-infected tomato leaves: a PLS-DA modeling comparison over a 1–7-day post-inoculation period. Smart Agricultural Technology, 15, Article 102629. https://doi.org/10.1016/j.atech.2026.102629
Image Credits: AI Generated
DOI: 10.1016/j.atech.2026.102629
Keywords: ToBRFV, tomato leaves, plant virus, visible-near-infrared spectroscopy, reflectance, absorbance, PLS-DA, SNV preprocessing, plant disease detection, greenhouse study, Temporal, spectral
Cite Scienmag News
Kristina Jarvis. (October 21, 2026). Reflectance spectra track early ToBRFV infection stages in tomato leaves. Scienmag. https://scienmag.com/reflectance-spectra-track-early-tobrfv-infection-stages-in-tomato-leaves/
Kristina Jarvis. "Reflectance spectra track early ToBRFV infection stages in tomato leaves." Scienmag, 21 October 2026, https://scienmag.com/reflectance-spectra-track-early-tobrfv-infection-stages-in-tomato-leaves/. Accessed 21 October 2026.
Kristina Jarvis. "Reflectance spectra track early ToBRFV infection stages in tomato leaves." Scienmag. October 21, 2026. https://scienmag.com/reflectance-spectra-track-early-tobrfv-infection-stages-in-tomato-leaves/


