


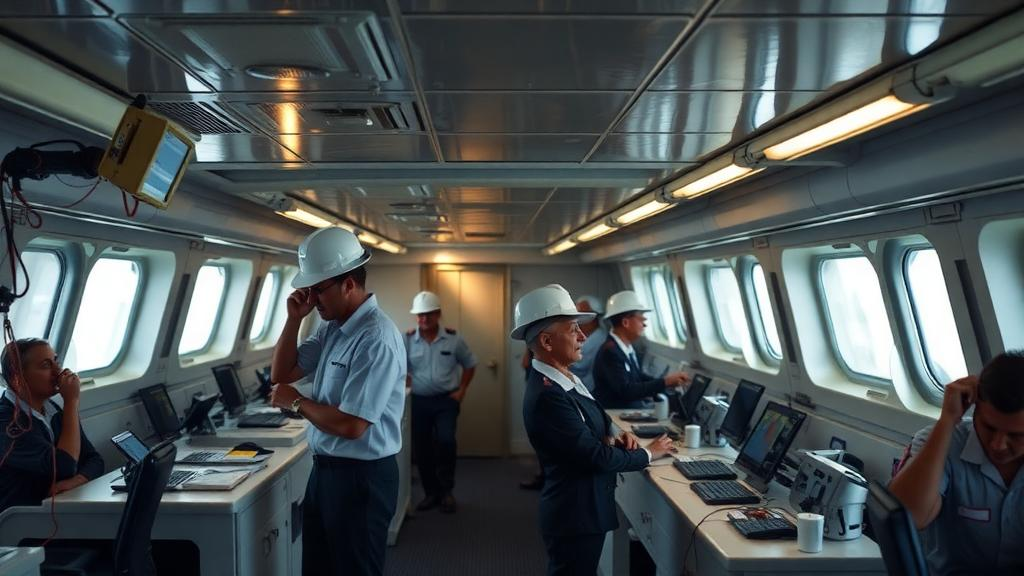
Noise was the leading source of indoor-environment dissatisfaction among crew members aboard a Baltic Sea cruise ship, while temperature and humidity measurements revealed sharply contrasting conditions across the vessel. An anonymous survey and a separate campaign of real-time sensors together showed that workplaces such as nightclubs, bars and restaurants could be noisy, warm or poorly ventilated, while the command bridge remained comparatively stable. The study was restricted to one ship and did not measure health outcomes, so its findings identify onboard conditions and areas for further investigation rather than demonstrate effects on crew health.
Researchers distributed the adapted MM-40 Indoor Air Questionnaire through the ship’s internal mailing list in October 2023. Of the 391 crew members invited, 124 responded, producing a response rate of 32%. Because workers rotated among stations, some evaluated more than one workplace, yielding 289 workstation-level responses. Respondents rated 15 environmental factors as causing no dissatisfaction, occasional dissatisfaction or definite dissatisfaction at their principal station over the preceding three months. The instrument had not been specifically validated for shipboard work, although it is widely used to assess indoor environments in Finland. The questionnaire excluded questions about symptoms, stress and the psychosocial work environment, and it was not designed to label individual sensor readings as good or bad.
Noise produced the highest overall complaint rate: 37.1% of the 289 responses selected “Yes” and another 30.8% selected “Sometimes,” meaning 67.9% reported at least some dissatisfaction. Dry air ranked next in the response-weighted results, with 35.3% saying “Yes” and 19.9% “Sometimes.” Insufficient ventilation was reported as “Yes” by 26.4% and “Sometimes” by 27.8%, while noticeable dust or dirt produced complaints in more than half of responses. Light reflections and cigarette odor were the least frequently cited concerns, with 84.0% and 82.7%, respectively, reporting no dissatisfaction. These figures describe reported discomfort rather than measured pollutant exposure or clinical illness.
Differences among workstations were pronounced. Fisher’s exact test with false-discovery-rate correction found significant variation in 11 of the 15 factors. The largest associations involved light reflections, weak lighting, excessive temperature, moist air, noise and fluctuating temperature, all classified as moderate effects by Cramér’s V. Employees in drinking establishments, including bars, nightclubs and casinos, reported the greatest dissatisfaction. Among 44 responses from that group, 65.9% answered “Yes” to noise and 79.5% reported at least some discomfort. They also had significantly higher odds of reporting nine problems than deck workers, although estimates based on sparse response categories remained uncertain.
Restaurant workers generally reported conditions close to the ship-wide average, while deck workers reported the least dissatisfaction. Office-like, storage and cleaning locations were another concern: among 21 responses placed in an “Other” category, 62% cited inadequate ventilation. The command bridge produced 13 responses, of which 82.2% indicated no major workplace issue, although dry air remained a concern there. The information desk had the highest proportion of “Yes” responses for overall dissatisfaction, but its sample was only five, meaning each response represented 20% of the estimate. These small groups, the aggregation of uncommon workplaces and the inability to link repeated answers to individual respondents limited the precision of comparisons. The statistical tests assumed independence among responses even when the same person evaluated multiple stations, which may have made some inferences anti-conservative.
The objective monitoring campaign, conducted from October through December 2024, covered nine occupied locations with Airlyse IAQ Analyser sensors. Temperature, relative humidity and carbon dioxide were recorded at 10-minute intervals, alongside particulate matter and total volatile organic compounds, which were reported as ethanol equivalents. Temperature sensors had an accuracy of ±0.4°C, humidity sensors ±3% relative humidity, and carbon dioxide sensors ±30 ppm plus 3% of the measured value. Particulate-matter and volatile-organic-compound sensors were factory-calibrated before installation. Airlyse Oy calibrated the temperature, humidity and carbon dioxide sensors one week before deployment using Testo precision gauges that the manufacturer calibrates every two years. Individual isolated total-volatile-organic-compound peaks without similarly high readings immediately before or after were treated as sensor errors and removed.
Most temperatures across the ship ranged from 20°C to 25°C, but the nightclubs were exceptions. Nightclub 1 readings reached 35°C, with all recorded values above 23°C, while nightclub 2 exceeded 23°C in 99.6% of its data. The open-kitchen restaurant also varied widely, usually spanning 18°C to 32°C, whereas the buffet kitchen, buffet dining hall, crew restaurant and command bridge showed relatively even temperatures. Relative humidity was generally lower, mostly 20% to 40%, with momentary readings as low as 9% on the command bridge. Below the Finnish recommended range of 30% to 50% for most of the monitoring period, the command bridge was below 30% in 85.4% of readings, nightclub 1 in 75.6% and the crew restaurant in 61.1%.
Carbon dioxide was usually between 400 and 600 parts per million, with short-lived increases above 1,000 parts per million at several locations. The bar had the largest share of readings above that threshold, at 1.5%, followed by nightclub 2 at 1.2%. Relative humidity readings above 50% were limited, with the open-kitchen restaurant recording the largest share at 1.0%; higher kitchen humidity was consistent with moisture generated during cooking. Particulate matter generally appeared low, with most values below 5 micrograms per cubic metre, while volatile organic compounds were usually below 100 parts per billion as ethanol equivalent. Both latter measurements were considered indicative only because most particulate readings lay within the sensor’s error margin and total volatile compounds lacked a comparable health-based guideline in ethanol equivalents.
Time-series data linked changes in temperature and carbon dioxide to likely periods of human activity. The buffet kitchen showed increases during breakfast and dinner preparation and service, while the open-kitchen restaurant and bar generally became warmer and more carbon-dioxide-rich toward the evening. The command bridge had the flattest profiles, consistent with its isolation and low foot traffic. Designers’ ventilation rates for the crew restaurant, open-kitchen restaurant and nightclub 1 were approximately 60%, 70% and 40%, respectively, of the corresponding Finnish area-based guideline values; the bar’s rate exceeded its area-based guideline, although occupancy-based requirements could not be evaluated. These figures point to a possible link between design ventilation and complaints, but the survey and monitoring occurred in different seasons and cannot be directly correlated.
The study’s main strength is its combination of subjective and objective evidence, which reveals where measured conditions and worker experience may converge or diverge. Its limitations are equally important: it covers one vessel, a 32% survey response rate, nine monitoring sites and only a subset of environmental hazards. Noise, lighting, microorganisms and outdoor exhaust were not continuously measured, the sensors could miss short peak exposures, and the separation of the survey and monitoring periods by about 12 months prevents direct validation. Future studies should monitor sound alongside occupancy, use more precise particulate and volatile-compound instruments, repeat surveys across seasons, include passengers and leisure areas, and examine multiple vessels. The present evidence nevertheless identifies noise, dry conditions, ventilation and nightclub heat as priority targets for better onboard environmental control.
Subject of Research: Crew-reported indoor environment quality and monitored air conditions aboard a Baltic Sea cruise ship
Article Title: Indoor air quality aboard cruise ships: Utilizing survey and monitoring approaches
Article References: Anttila, E., Vornanen-Winqvist, C., Clinchard, S., Korja, N., Mikkola, R., Alapieti, T., & Salonen, H. (2026). Indoor air quality aboard cruise ships: Utilizing survey and monitoring approaches. Environmental Advances, Article 100772. https://doi.org/10.1016/j.envadv.2026.100772
Image Credits: AI Generated
DOI: 10.1016/j.envadv.2026.100772
Keywords: cruise ships, indoor air quality, crew survey, occupational comfort, noise complaints, relative humidity, carbon dioxide, ventilation, environmental sensors, workstations, Indoor, quality
Cite Scienmag News
Sloane Callahan. (October 21, 2026). Cruise ship crew report noisy workplaces amid uneven indoor conditions. Scienmag. https://scienmag.com/cruise-ship-crew-report-noisy-workplaces-amid-uneven-indoor-conditions/
Sloane Callahan. "Cruise ship crew report noisy workplaces amid uneven indoor conditions." Scienmag, 21 October 2026, https://scienmag.com/cruise-ship-crew-report-noisy-workplaces-amid-uneven-indoor-conditions/. Accessed 21 October 2026.
Sloane Callahan. "Cruise ship crew report noisy workplaces amid uneven indoor conditions." Scienmag. October 21, 2026. https://scienmag.com/cruise-ship-crew-report-noisy-workplaces-amid-uneven-indoor-conditions/


