


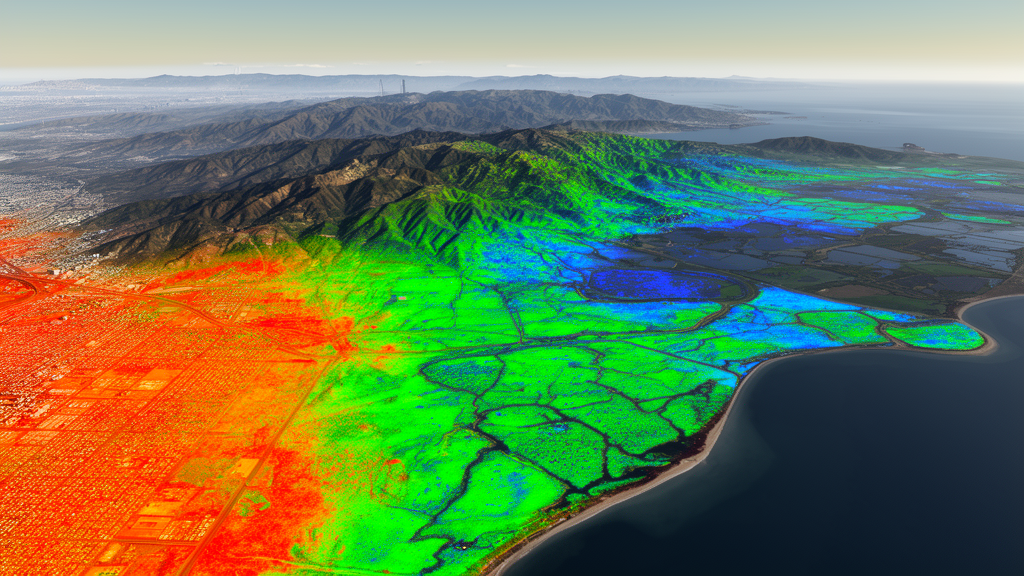
Extreme summer surface heat was associated with weaker carbon uptake across the Guangdong–Hong Kong–Macao Greater Bay Area in a regional remote-sensing and spatial machine-learning study. Researchers combined satellite observations, climate reanalysis and carbon-budget modeling to examine relationships among land surface temperature, net primary productivity and soil respiration in summer 2023. They identified an apparent transition interval near 27.1–28.1 °C, where modeled net primary productivity began declining more rapidly, and a separate estimate of 32.05 °C at which productivity could fall below estimated soil respiration, indicating source-like carbon balance. The authors treated these as complementary rather than interchangeable thermal markers: one describes the onset of accelerated productivity loss, while the other estimates a transition from net carbon uptake to net carbon release.
The observational study covered approximately 55,300 square kilometers spanning 11 cities and jurisdictions in the Pearl River Delta, from dense metropolitan districts around the estuary to forested mountains in the north and west. Its authors said the region provides a pronounced setting for studying heat–carbon coupling because cool, densely vegetated mountain forests border subtropical urban landscapes where summer daytime land surface temperatures frequently exceed 35 °C and can surpass 40 °C in extreme heat-island cores. The analysis used 4,158 spatially representative samples retained after quality control, covering urban cores, suburban transition zones, agricultural plains and peripheral ecological areas. Because the design was confined to one summer and paired with annual productivity data, it estimates regional associations and apparent thresholds rather than demonstrating how carbon storage changes over time.
To assemble the evidence, the team processed several datasets through Google Earth Engine. Summer 2023 land surface temperature and vegetation greenness came from MODIS products at 1-kilometer resolution, while net primary productivity was represented by the 500-meter annual MODIS product. ERA5-Land supplied mean 2-meter air temperature and monthly precipitation for June through August, and a 30-meter digital elevation model provided elevation and slope. Sampling combined 3,000 random points, 1,500 systematically spaced points and 500 denser observations in urban–rural transition zones, where temperature, vegetation and land cover changed rapidly. The strategy was designed to avoid concentrating the analysis in either the hottest city centers or the cooler forest belt. Values were extracted at each sample location at their native resolutions after coordinate harmonization, rather than being unnecessarily resampled.
The analytical framework combined four methods. Geographically weighted regression generated local coefficients describing how six environmental predictors varied in their relationships with productivity across space. Those local sensitivities were supplied to an enhanced XGBoost model, allowing gradient-boosted decision trees to represent nonlinear patterns and interactions while remaining spatially informed. SHAP, or SHapley Additive exPlanations, attributed model predictions to individual variables and traced the influence of temperature across its range. A Q10 respiration model then converted productivity estimates into a carbon budget by comparing net primary productivity with estimated soil heterotrophic respiration. Spatial block cross-validation was used to reduce the inflated performance that can arise when spatially autocorrelated neighboring samples are divided randomly between training and test data.
Land surface temperature emerged as the most influential feature in the enhanced model and had a strong negative Pearson correlation with net primary productivity, with a coefficient of −0.68. Vegetation greenness, represented by the normalized difference vegetation index, had a strong positive association with productivity at 0.72, while 2-meter air temperature was negatively correlated with productivity at −0.59. Surface temperature was itself negatively associated with greenness at −0.72, and greenness was positively associated with productivity at 0.72. Elevation was positively related to productivity at 0.56 and negatively related to surface temperature at −0.63. By contrast, precipitation had little association with productivity, with a correlation of −0.05. These are statistical relationships, not proof that any single variable directly caused the observed differences, but together they describe a coherent spatial pattern of hot, sparsely vegetated surfaces and lower modeled carbon fixation.
Machine-learning interpretation located the onset of accelerated productivity decline at approximately 27.1–28.1 °C. At lower temperatures, the SHAP contribution of surface temperature was positive or close to zero, whereas it became increasingly negative as conditions heated. A separate analysis of the distribution of respiration-constrained net ecosystem productivity identified a transition interval of roughly 28.93–29.93 °C. That interval also concerns an onset location, but it was calculated from carbon-budget estimates rather than from the SHAP analysis of productivity. The third value, an estimated source–sink switch of 32.05 °C, came from the central Q10 = 2.0 respiration scenario, under which mean net primary productivity fell below estimated soil respiration as surface temperature approached 32 °C. The switch moved earlier with Q10 = 2.5 and later with Q10 = 1.5, showing how the respiration parameter introduces uncertainty into the estimate.
Geographically weighted coefficients showed that thermal sensitivity was far from uniform. About 76% of the study area had negative local temperature coefficients. In the hottest urban cores around the Pearl River estuary and the Shenzhen–Dongguan corridor, mean land surface temperature exceeded 36 °C, the mean local coefficient was approximately −0.182 and mean net primary productivity was 0.32 kgC/m²/yr. Suburban areas with temperatures of 28–36 °C had intermediate coefficients of roughly −0.08 to −0.12. In the cooler northern mountains, where land surface temperature was generally below 28 °C, mean net primary productivity reached 1.21 kgC/m²/yr and the local temperature coefficient was slightly positive, about +0.043. The negative temperature sensitivity in urban cores was reported as 4.2 times greater than in peripheral forested ecological zones, a difference obscured by spatially uniform analyses.
Carbon-budget classification estimated that 93.6% of sampled locations, or 3,892 sites, remained carbon sinks, while 6.4%, or 266 locations, were estimated to be carbon sources. Among the sinks, 1,886 were classified as strong sinks, 1,359 as sinks and 647 as weak sinks. Strong sinks formed a largely continuous belt through the northern mountainous forest and western agricultural–forestry zones. Most of the 266 source locations were weak sources, with only three classified as strong sources in the extreme urban heat-island cores of Shenzhen Bao’an, southern Dongguan and inner Guangzhou. The spatial model therefore depicts a pronounced regional gradient rather than a uniform outcome: sink capacity weakened toward the urbanized estuary, while substantial modeled carbon uptake remained in the vegetated mountainous periphery.
Vegetation appeared to buffer, but not eliminate, the association between heat and productivity loss. At the same surface temperature, locations with normalized difference vegetation index values below 0.3 had SHAP values approximately 2.5 times more negative than those with values above 0.6. The enhanced model also slightly outperformed standard XGBoost: mean test R² increased from 0.6179 to 0.6318, an improvement of about 2.2%, with the largest gains in folds containing many urban–rural transition samples. The result supports the value of representing spatial heterogeneity, but the study has important limitations. Annual productivity does not resolve the timing of summer heat effects; the Q10 parameter may vary with soil moisture and local conditions; a single season cannot reveal whether the apparent thresholds persist under acclimatization or carryover effects; and MODIS resolution can blur small urban refuges and fine-scale forest structure. The findings are best understood as a regional risk map and a basis for further monitoring, not as a universal physical tipping point or direct proof that heat caused the observed carbon losses.
Subject of Research: Spatial modeling of summer heat effects on carbon-sink stability across the Greater Bay Area
Article Title: Apparent thermal thresholds of carbon sink weakening in the Guangdong–Hong Kong–Macao Greater Bay Area revealed by remote sensing and spatial machine learning
Article References: Li, C., Yu, H., Sun, B., Wu, J., Wang, H., & Hong, T. (2026). Apparent thermal thresholds of carbon sink weakening in the Guangdong–Hong Kong–Macao Greater Bay Area revealed by remote sensing and spatial machine learning. Frontiers in Forests and Global Change, 9, 1996868. https://doi.org/10.3389/ffgc.2026.1996868
Image Credits: AI Generated
DOI: 10.3389/ffgc.2026.1996868
Keywords: carbon sinks, extreme heat, land surface temperature, net primary productivity, remote sensing, spatial machine learning, urban heat island, forest carbon, Greater Bay Area, soil respiration, Apparent, thermal
Cite Scienmag News
Teresa Odom. (October 21, 2026). Remote sensing maps apparent heat thresholds for Greater Bay Area carbon sinks. Scienmag. https://scienmag.com/remote-sensing-maps-apparent-heat-thresholds-for-greater-bay-area-carbon-sinks/
Teresa Odom. "Remote sensing maps apparent heat thresholds for Greater Bay Area carbon sinks." Scienmag, 21 October 2026, https://scienmag.com/remote-sensing-maps-apparent-heat-thresholds-for-greater-bay-area-carbon-sinks/. Accessed 21 October 2026.
Teresa Odom. "Remote sensing maps apparent heat thresholds for Greater Bay Area carbon sinks." Scienmag. October 21, 2026. https://scienmag.com/remote-sensing-maps-apparent-heat-thresholds-for-greater-bay-area-carbon-sinks/


