


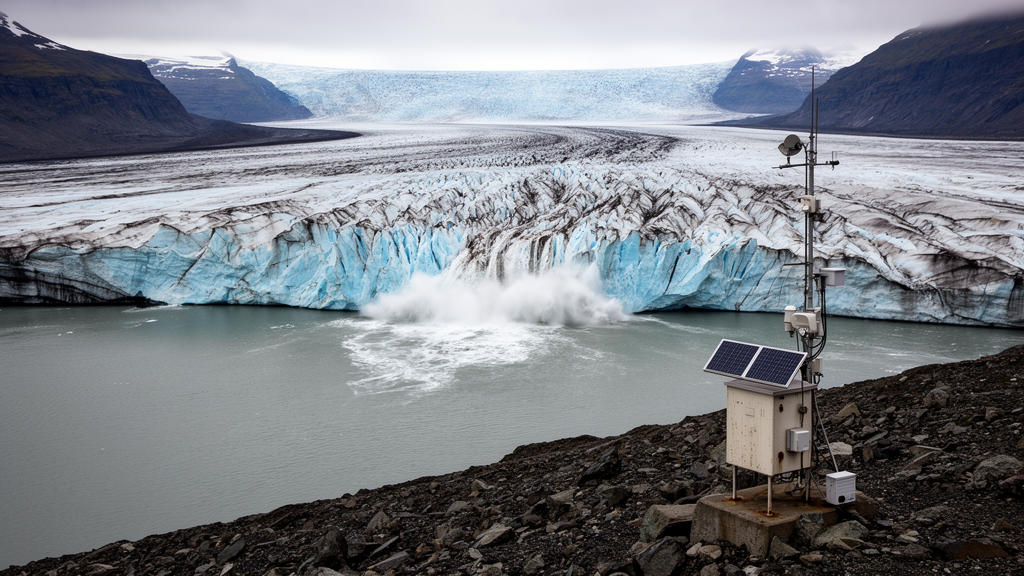
Glaciers outside the ice sheets are already losing roughly 273 billion tonnes of ice every year, and they have pushed global sea levels up by about 18 millimetres since the turn of the century. Nearly every projection of how much more ice they will surrender depends on computer models that crunch climate data in monthly chunks. A new study published in Nature Communications argues that this monthly shortcut is quietly hiding a substantial share of future melt, and that fixing it adds tens of millimetres to projected sea-level rise by 2100.
Lander Van Tricht of ETH Zürich and colleagues rebuilt the Global Glacier Evolution Model, known as GloGEM, so that it ingests daily temperature and precipitation rather than monthly averages. They ran both versions across more than 12,500 glaciers larger than five square kilometres, which together hold about 94 percent of the world’s glacier ice, and compared the results against more than 4,000 independent field measurements of annual mass balance. The daily version tracked the observations more closely overall, but its real advantage emerged in extreme years, when the gap between model and reality matters most.
During the record Alpine melt year of 2022, the daily model simulated a mass balance 0.31 metres of water equivalent more negative than the monthly version, landing substantially closer to what glaciologists actually measured. Similar improvements appeared in Western Canada and the United States in 2023 and in Svalbard in 2024, where the daily-monthly difference reached nearly a metre of water equivalent. For anomalies more than two standard deviations from the mean, the daily model cut the root mean squared error from 0.98 to 0.83 metres. In other words, the monthly model systematically underestimates the damage done by heatwaves and overestimates the relief provided by cold spells.
The physical reasons are straightforward. Monthly averaging smooths away the very days on which glaciers lose most of their ice. A single scorching week inside an otherwise mild month barely registers in a monthly mean, yet it can strip metres of snow and expose dark underlying ice, which absorbs more sunlight and melts faster in a runaway feedback. Daily forcing also captures the exact temperature at which precipitation flips between snow and rain, a threshold that determines whether a storm adds mass to a glacier or washes away. And because the daily model updates surface type, snow versus ice, every day rather than once a month, it reproduces the seasonal timing of these transitions far more faithfully.
Those differences cascade into projections. By 2100, the daily model projects global ice volume losses of 26 percent, plus or minus 10, under the low-emission SSP1-2.6 scenario and 47 percent, plus or minus 17, under the high-emission SSP5-8.5 scenario, relative to 2025. That is an additional 5 to 10 percent of mass loss compared with the monthly implementation, equivalent to 20 to 33 extra millimetres of global mean sea-level rise. The divergence grows steadily throughout the century and shows no sign of stabilising by 2100, which matters because glaciers respond on multi-centennial timescales.
The regional pattern is strikingly uneven. In low-relief, ice-cap-dominated regions such as Svalbard, the Russian Arctic and the Antarctic and Sub-Antarctic islands, the narrow elevation range amplifies the sensitivity of melt-albedo and surface-type feedbacks, and the daily model projects up to 25 percent greater ice loss by 2100 than the monthly version. Mid-latitude regions with limited ice, such as Central Europe and the Caucasus, show a transient divergence peaking around mid-century before both models converge on near-total deglaciation. Alaska, Scandinavia and the Southern Andes fall in between, with the daily model typically projecting 2 to 5 percent more loss.
Iceland is the lone exception, and it is instructive. There, heavy precipitation frequently arrives with warm south-westerly air masses from the North Atlantic, while cold northerly periods tend to be dry. Resolving this co-occurrence at daily timescales means more precipitation is classified as rain rather than snow, reducing accumulation. The monthly model smooths over those warm, wet days, overestimates snowfall, and consequently projects about 4 percent more ice loss than the daily version by 2100. A sensitivity experiment in which the monthly model received daily-based precipitation phase confirmed that this partitioning, not melt, drives Iceland’s reversed behaviour.
The study also reframes how glacier models talk to hydrologists. Runoff, defined as the sum of ice melt, snow melt and rainfall over glacierised terrain minus refreezing, is the primary channel through which glacier change reaches downstream water systems. The daily model resolves the seasonal peak in flow and its future shifts: in Western Canada and the United States, peak glacier runoff is projected to arrive roughly 46 days earlier by 2100, a shift the monthly model misrepresents by about 15 days. In High Mountain Asia, the daily model finds that ice melt supplies 70 to 80 percent of late-summer glacier runoff today, against 44 percent in the monthly configuration, a discrepancy with direct consequences for the nearly one-tenth of humanity that depends on glacier-fed water towers.
Daily resolution is not free. The authors report that the daily version takes roughly ten times longer to run than the monthly one, which helps explain why most state-of-the-art global models still use aggregated forcing. But the paper suggests cheaper fixes: correcting the assumption that sub-monthly temperature variability stays constant as the climate warms, and improving precipitation-phase partitioning in monthly models, could remove much of the structural bias without full daily computation. Remotely sensed snowline and snow-cover datasets offer a further route to constrain where models place the transient snowline, a quantity the daily model can be validated against directly.
The broader message is that temporal resolution is not a technical footnote but a modelling choice with measurable consequences for coastal flood exposure, erosion and saltwater intrusion. As heatwaves grow more frequent and more intense, models that average them away will keep underestimating how fast the world’s mountain ice is disappearing. The 20 to 33 extra millimetres of sea-level rise that emerge simply from reading the weather day by day are, the authors argue, a lower bound on what better-resolved physics will reveal as global glacier models continue to converge on the messy, day-to-day reality of a warming atmosphere.
Subject of Research: Effect of daily versus monthly meteorological forcing on global glacier mass loss and sea-level rise projections
Article Title: Resolving short-term meteorological variability amplifies projected glacier loss and sea-level rise
Article References: Van Tricht, L., Huss, M., Zekollari, H., Aguayo, R., Beer, J., van Tiel, M., von der Esch, A., & Farinotti, D. (2026). Resolving short-term meteorological variability amplifies projected glacier loss and sea-level rise. Nature Communications, 17(1), Article 10696. https://doi.org/10.1038/s41467-026-78260-y
Image Credits: AI Generated
DOI: 10.1038/s41467-026-78260-y
Keywords: glaciers, sea-level rise, climate modelling, GloGEM, mass balance, daily forcing, heatwaves, Svalbard, glacier runoff, CMIP6, cryosphere, Nature Communications
Cite Scienmag News
Violet Maxwell. (October 19, 2026). Daily Weather Data Reveals Glaciers Are Melting Faster Than Models Predicted. Scienmag. https://scienmag.com/daily-weather-data-reveals-glaciers-are-melting-faster-than-models-predicted/
Violet Maxwell. "Daily Weather Data Reveals Glaciers Are Melting Faster Than Models Predicted." Scienmag, 19 October 2026, https://scienmag.com/daily-weather-data-reveals-glaciers-are-melting-faster-than-models-predicted/. Accessed 19 October 2026.
Violet Maxwell. "Daily Weather Data Reveals Glaciers Are Melting Faster Than Models Predicted." Scienmag. October 19, 2026. https://scienmag.com/daily-weather-data-reveals-glaciers-are-melting-faster-than-models-predicted/


