


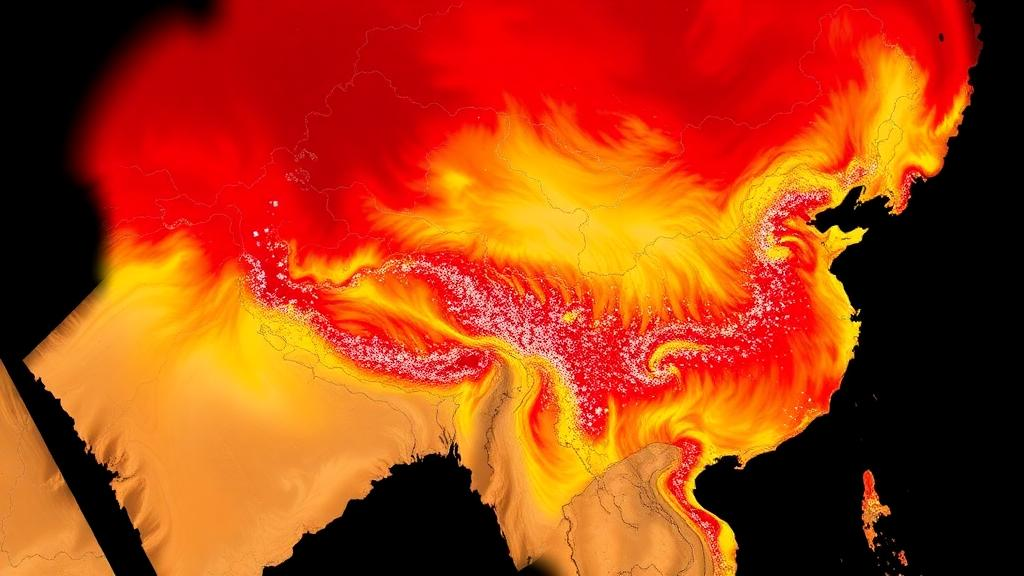
Every weather forecast, climate model, and air quality warning depends on knowing how temperature changes with height in the atmosphere. Satellites promise to deliver that vertical picture continuously, at high resolution, over every corner of the planet. But how much can we actually trust them? A new study published in Atmospheric Measurement Techniques has delivered one of the most exhaustive reality checks yet for a flagship NASA product, comparing 18 years of satellite-derived temperature profiles against weather balloon measurements from 74 stations across mainland China. The verdict is nuanced: the satellite performs well in the free atmosphere but stumbles in the turbulent, complex layer closest to the ground.
The product under scrutiny is MOD07_L2, the atmospheric profile dataset generated from the Moderate Resolution Imaging Spectroradiometer, or MODIS, flying aboard NASA’s Terra satellite. MODIS scans the atmosphere in multiple thermal infrared channels and retrieves temperature at 20 standard pressure levels, from 1000 hectopascals near the surface up to 5 hectopascals at the edge of space, all at a spatial resolution of 5 kilometers. That combination of fine horizontal detail and full vertical coverage has made MOD07_L2 a workhorse for regional studies in atmospheric science, hydrology, and ecology. Yet, until now, no nationwide assessment had tested its vertical temperature profiles across China’s extraordinary diversity of terrain and climate, from the humid southern plains to the arid northwest and the towering Tibetan Plateau, whose average elevation exceeds 4000 meters.
The research team, led by Wenjie Zhang and Yuanjian Yang of Nanjing University of Information Science and Technology together with colleagues from the Chinese Academy of Sciences and institutions in Uzbekistan, took on the challenge with a formidable dataset. They assembled radiosonde observations, the classic weather balloon soundings collected by the China Meteorological Administration, from 74 stations spanning 2003 to 2020. These balloons rise twice daily, at 00:00 and 12:00 UTC, measuring temperature, pressure, and humidity at more than 100 pressure levels from the surface to the upper atmosphere. The soundings follow the rigorous quality-control standards of the World Meteorological Organization’s GCOS Upper-Air Network, and data completeness across the selected stations exceeded 90 percent, providing a trustworthy benchmark for the satellite comparison.
Matching satellite snapshots to balloon measurements is trickier than it sounds. Terra flies a sun-synchronous orbit, so its overpass time drifts across China, arriving earlier in the east than in the west. The team therefore ran a sensitivity experiment on the time-matching window, testing allowable differences between satellite and balloon observation times from under half an hour up to 2 hours. The results were reassuring: widening the window to 2 hours dramatically increased the number of matched records, from roughly 554,000 to 894,000 during daytime and from about 300,000 to 711,000 at nighttime, while national-scale accuracy barely changed. Averaged across nine pressure levels, daytime correlation, bias, and root mean square error shifted only marginally, and nighttime statistics actually improved slightly. The 2-hour window was retained for all subsequent analyses, maximizing sample coverage without sacrificing precision.
The headline finding concerns where in the vertical column the satellite excels and where it falters. In the upper layers, between 400 and 620 hectopascals, roughly the mid-troposphere, MOD07_L2 retrievals agreed closely with the balloons, with correlation coefficients of at least 0.95 and root mean square errors as low as 2.21 degrees Celsius at night. But accuracy degraded steadily toward the surface. At 850 and 920 hectopascals, levels that sit close to the ground over much of China, the satellite showed pronounced negative biases, meaning it systematically underestimated temperature. During daytime, the biases reached 2.03 and 2.14 degrees Celsius respectively, with root mean square errors of 3.74 and 4.11 degrees Celsius. Nighttime performance was better across the board, with smaller biases and lower errors at every level, but the lower-tropospheric penalty persisted.
The spatial patterns tell an equally important story. During daytime, upper-layer retrievals performed best over the flat northern regions, including the Northeast China Plain, the Northern Arid and Semi-Arid Region, and the Huang-Huai-Hai Plain, where correlations exceeded 0.95 and biases stayed within 2 degrees Celsius. Lower-layer errors, by contrast, ballooned over humid southern China, including the Middle-Lower Yangtze Plain, the Sichuan Basin, and the Yunnan-Guizhou Plateau, where root mean square errors exceeded 3.5 degrees Celsius at some stations. At night, performance improved over most regions, particularly the Huang-Huai-Hai and Yangtze plains, but pronounced negative biases approaching 4 degrees Celsius emerged over the arid north and northeast. The Tibetan Plateau proved especially challenging, a consequence of its extreme elevation pushing standard pressure levels close to the surface and its fierce diurnal temperature swings distorting the thermal infrared signals MODIS relies on.
Why does the satellite struggle near the ground? The authors attribute the lower-tropospheric errors to a convergence of physical effects. Surface longwave radiation interferes more strongly with measurements in the lower atmosphere, surface thermal inertia varies more erratically, and complex terrain drives local circulations and temperature fluctuations that a 5-kilometer pixel cannot resolve. Uncertainties in surface temperature and spectral emissivity propagate directly into retrieved temperatures at 850 and 920 hectopascals. Moreover, MODIS’s broad vertical weighting functions and limited vertical sampling tend to smooth out sharp temperature gradients and warm anomalies in the lower atmosphere, contributing to systematic underestimation. Water vapor absorption and residual thin-cloud contamination further dampen the sensitivity of infrared radiances, particularly in humid regions like the Sichuan Basin, where frequent stratiform cloud and topographic enclosure compound the problem.
The study went beyond raw temperature accuracy to test two derived parameters of great practical importance. The first is lower tropospheric stability, or LTS, the difference in potential temperature between 700 hectopascals and the near-surface layer, a key indicator of vertical mixing that governs convective activity, pollution episodes, humidity fluctuations, and precipitation extremes. Here the day-night pattern flipped: MODIS-derived LTS was more accurate during daytime, with a correlation of 0.74, a bias of only 0.33 kelvin, and a root mean square error of 4.52 kelvin, than at nighttime, where correlation fell to 0.57, the bias deepened to 3.59 kelvin, and the error rose to 6.78 kelvin. The explanation lies in the nature of LTS as a vertical gradient measure. Although absolute temperatures are retrieved better at night, nocturnal inversions and stable stratification create sharp, thin vertical temperature structures that the satellite’s coarse vertical resolution cannot resolve, leading to overestimated near-surface potential temperatures and underestimated stability.
The second derived parameter, temperature inversion layer detection, delivered the study’s most sobering result. Inversions, layers where temperature rises with height instead of falling, suppress vertical mixing and trap aerosols and pollutants, making their detection crucial for air quality forecasting. Yet MOD07_L2 co-detected inversions with the balloons in only 6.6 percent of daytime profiles and 13.1 percent of nighttime profiles. Detection was concentrated in the colder northern regions, reaching 29.9 percent at night in the Northeast China Plain and 20.0 percent in the Northern Arid and Semi-Arid Region, where inversions tend to be thicker and stronger. Over the Tibetan Plateau, the satellite detected essentially no inversions at all, and over the humid south, thin, weak elevated inversions proved nearly invisible to the infrared retrievals. The 5-kilometer footprint likely averages out thin inversion structures, and the product’s 20 standard pressure levels are too coarsely spaced to capture shallow near-surface inversions.
The implications reach well beyond one satellite product. For users of the MODIS archive, the study provides an actionable map of where and when MOD07_L2 temperature profiles, stability estimates, and inversion detections can be trusted, and where they require caution or correction. For developers of current and future missions, such as the VIIRS instrument on the Suomi NPP and JPSS satellites, the findings highlight the enduring challenge of probing the atmospheric boundary layer from orbit and point toward the value of finer vertical sampling, better cloud screening, and multi-source data fusion. The authors propose refining spatiotemporal matching schemes, deepening error attribution with cloud, aerosol, and terrain data, and integrating complementary observations to push retrieval accuracy further. As climate change reshapes the vertical structure of the atmosphere, warming the troposphere while cooling the stratosphere, knowing exactly what our satellites can and cannot see has never mattered more.
Subject of Research: MODIS satellite temperature profiles validated against 18 years of Chinese weather balloon data
Article Title: Comprehensive validation of MODIS atmospheric temperature profile data across mainland China using sounding observations
Article References: Zhang, W., Qu, M., Sun, R., Zhao, J., Ning, G., Inamov, A., Mamatkulov, Z., Zhou, D., Pulatov, B., & Yang, Y. (2026). Comprehensive validation of MODIS atmospheric temperature profile data across mainland China using sounding observations. Atmospheric Measurement Techniques, 19(20), 6535-6552. https://doi.org/10.5194/amt-19-6535-2026
Image Credits: AI Generated
Keywords: MODIS, MOD07_L2, atmospheric temperature profiles, radiosonde validation, lower tropospheric stability, temperature inversion layers, China, remote sensing, Comprehensive, validation, atmospheric, temperature
Cite Scienmag News
Russell Cooper. (October 19, 2026). MODIS satellite temperature profiles put to the test across 18 years of Chinese weather balloon data. Scienmag. https://scienmag.com/modis-satellite-temperature-profiles-put-to-the-test-across-18-years-of-chinese-weather-balloon-data/
Russell Cooper. "MODIS satellite temperature profiles put to the test across 18 years of Chinese weather balloon data." Scienmag, 19 October 2026, https://scienmag.com/modis-satellite-temperature-profiles-put-to-the-test-across-18-years-of-chinese-weather-balloon-data/. Accessed 19 October 2026.
Russell Cooper. "MODIS satellite temperature profiles put to the test across 18 years of Chinese weather balloon data." Scienmag. October 19, 2026. https://scienmag.com/modis-satellite-temperature-profiles-put-to-the-test-across-18-years-of-chinese-weather-balloon-data/


