


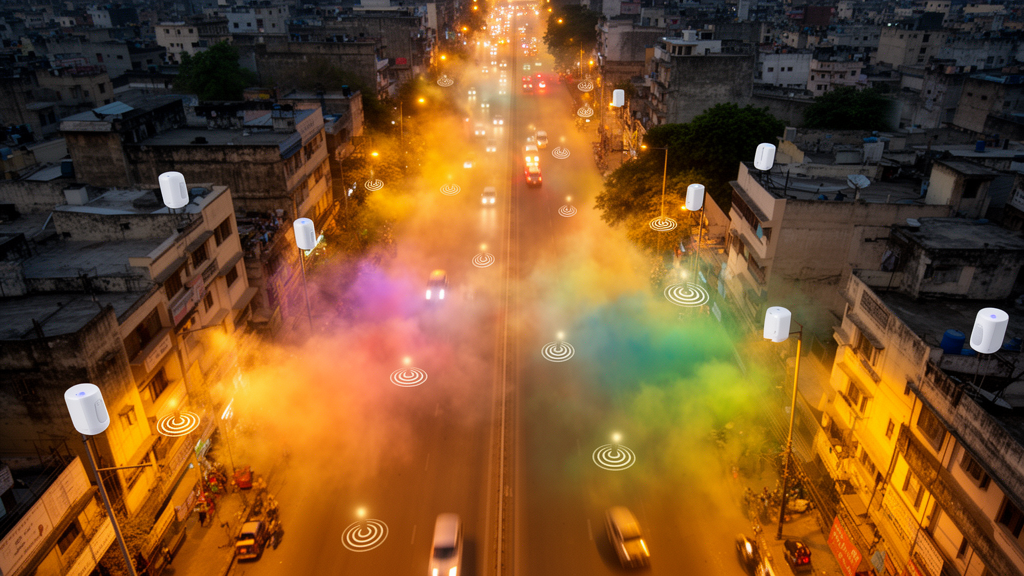
Air pollution remains one of the most pressing public health challenges in India, and particulate matter is its primary contributor. According to the researchers behind a new study from the International Institute of Information Technology Hyderabad, average concentrations of PM2.5 and PM10 in India stand at 55.8 and 131 micrograms per cubic meter respectively, roughly eleven times higher than the guideline values set by the World Health Organization. In 2019, an estimated 6.7 million premature deaths worldwide were associated with air pollution. Yet despite these stark figures, most Indian cities rely on a handful of expensive, centralized monitoring stations that cannot capture how pollution varies from one street to the next.
The new research, published in Frontiers in the Internet of Things, argues that the solution lies in densely deployed networks of low-cost, IoT-enabled particulate matter sensors. Traditional instruments such as beta attenuation monitors and tapered element oscillating microbalances are highly accurate but bulky and expensive, which makes dense deployment impossible. In Hyderabad, a metropolitan region of more than 6.7 million people spread over 650 square kilometers, the Central Pollution Control Board and the Telangana State Pollution Control Board operate only twelve centralized air quality monitoring stations. Pollutant levels can vary drastically even between smaller blocks within a city, so a dozen stations simply cannot resolve that spatial variability.
To bridge this gap, the team developed an end-to-end low-cost IoT system and deployed 49 devices across approximately 4 square kilometers of the Gachibowli region of Hyderabad. Forty-three devices were built in-house, while six commercial Airveda monitors were added for comparison. The in-house device is built around the TTGO T-Call ESP32 microcontroller, which reads a Nova SDS011 laser light-scattering particulate sensor and an SHT21 temperature and humidity sensor every 30 seconds. The SHT21 is included because light-scattering sensors become unreliable at high temperature and relative humidity levels, allowing unreliable PM values to be filtered out. Data packets of 24 bytes are offloaded to the ThingSpeak cloud platform using the secure MQTTS protocol over Wi-Fi or a 2G cellular network, with an embedded SIM customized for IoT applications to prevent theft-related misuse and avoid carrier lock-in.
Robustness against data loss was a central design goal. Each device is powered by an AC-to-DC adapter with a 1,000 mAh lithium polymer battery that switches on automatically when AC power fails, ensuring uninterrupted operation. If network connectivity drops, sensed data is cached in a portion of the microcontroller’s 540 KB RAM, up to a maximum of 20,000 data points, and transmitted in bulk once the connection is restored. If a prolonged outage fills the cache, stored points are cleared in first-in-first-out order to make room for new data. The complete device, enclosed in a dust-proof and water-resistant IP65 box of 125 by 125 by 125 millimeters, costs about 7,000 Indian rupees, roughly 84 US dollars, a fraction of the price of commercial monitors that retail for up to 64,900 rupees in the Indian market.
Calibration was treated as rigorously as hardware design. Each low-cost sensor was co-located with a precise Aeroqual S500 reference instrument in a ventilated room for a week, generating roughly 20,160 data points per sensor. Before calibration, all sensors followed the reference in trend but differed by unique offsets in absolute value, so simple linear regression was used to learn individual correction parameters for every device. The team chose linear regression because it compensates for offsets well while preserving the trend in the data, and it achieved strong agreement with the reference instrument, with R-squared values of 0.99 for PM2.5 and 0.87 for PM10. Because sensor behavior changes with the seasons, separate calibration functions were computed at the onset of each season.
Data preprocessing removed unreliable readings before analysis. Values recorded at relative humidity above 80 percent, where PM10 readings are unreliable, and raw values outside the sensor range of 0 to 999 micrograms per cubic meter were discarded, accounting for about 0.5 percent of the dataset. Outliers were then identified with the interquartile range method, flagging a further 1.4 percent, and the remaining gaps of about 1.9 percent were filled with simple linear interpolation. Field deployment was completed in July 2021, and usable data were collected over seven months spanning all seasons, from August 2021 to June 2022, aggregating 20.7 million data points. The 4-square-kilometer study area was divided into roughly 42 boxes of 400 by 400 square meters, with an attempt to place one device in each box, covering urban, semi-urban, and green regions as well as busy traffic junctions and roadside poles.
The seven-month dataset revealed striking seasonal and spatial patterns. Mean and variance of PM10 were highest in winter, when temperature inversion traps cold air and particulates near the ground, and lowest during the monsoon, when frequent rainfall settles the particles. Among the 49 devices, the highest mean PM10 values appeared at a traffic junction, a green region undergoing construction activity, and a roadside location with sluggish traffic flow, while the lowest values occurred in a quiet residential area and roadside sites with free-flowing traffic. Inverse distance weighting was used to interpolate PM10 concentrations at unmonitored locations, producing maps at 11 a.m., 2 p.m., and 9 p.m. for each season. Concentrations peaked during morning and evening office and peak traffic hours and dipped in the early afternoon as traffic thinned.
The network’s density proved its worth during the Diwali festival. On the evening of 4 November 2021, widespread firecracker bursting produced a clear peak in PM10 across all devices, with one commercial monitor rising from 40 to 307 micrograms per cubic meter before and after the celebrations. Concentrations fell sharply within a few hours, indicating a temporary, activity-driven spike. When the team simulated sparse deployments of 12 and 4 devices, the results were sobering: interpolation with 12 devices could identify the event but missed local hotspots, while 4 devices missed the event entirely and could be misleading. The root mean square error rose from 32.47 with 12 devices to 59.29 with 4 devices, demonstrating that sparse networks risk erroneous interpretations of actual pollution levels and distribution.
Correlation analysis offered a concrete guideline for future deployments. Using Kendall’s tau on hourly averaged PM10 samples, the team fitted a two-term exponential model showing that the correlation coefficient changes rapidly between devices less than 350 meters apart, after which the decline becomes gradual. This suggests that particulate matter monitors should be deployed at most 350 meters apart to capture spatial variability accurately in a densely packed urban landscape like Gachibowli, where office spaces, highways, residential complexes, and parks coexist within a small area. The researchers also built a responsive web-based dashboard, named AirIoT, built on the Django framework with PostgreSQL and real-time updates every 10 minutes, allowing users to view device locations on an interactive map, examine 48-hour trends, and access data through OAuth-authenticated APIs.
The findings carry direct implications for city planning authorities, who can use the network and its data to guide urban planning, infrastructure development, and targeted pollution mitigation. The team suggests that future work could explore adaptive, non-parametric sensing rates that change dynamically based on recent historical data to make collection more robust and energy efficient, as well as advanced interpolation techniques such as Kriging. For now, the study stands as a compelling demonstration that calibrated low-cost sensors, deployed densely enough, can reveal the street-level texture of air pollution that a dozen centralized stations never could.
Subject of Research: Dense deployment of low-cost IoT particulate matter monitoring network in Hyderabad, India
Article Title: Development of end-to-end low-cost IoT system for densely deployed PM monitoring network: an Indian case study
Article References: Parmar, A., Sara, S., Dwivedi, A. K., Reddy, C. R., Patwardhan, I., Bijjam, S. D., Chaudhari, S., Rajan, K. S., & Vemuri, K. (2024). Development of end-to-end low-cost IoT system for densely deployed PM monitoring network: an Indian case study. Frontiers in the Internet of Things, 3, Article 1332322. https://doi.org/10.3389/friot.2024.1332322
Image Credits: AI Generated
DOI: 10.3389/friot.2024.1332322
Keywords: air pollution, particulate matter, IoT, low-cost sensors, Hyderabad, PM2.5, PM10, sensor calibration, dense deployment, Diwali, spatial interpolation, web dashboard
Cite Scienmag News
Russell Cooper. (October 17, 2026). Dense low-cost IoT network maps street-level air pollution across Hyderabad. Scienmag. https://scienmag.com/dense-low-cost-iot-network-maps-street-level-air-pollution-across-hyderabad/
Russell Cooper. "Dense low-cost IoT network maps street-level air pollution across Hyderabad." Scienmag, 17 October 2026, https://scienmag.com/dense-low-cost-iot-network-maps-street-level-air-pollution-across-hyderabad/. Accessed 17 October 2026.
Russell Cooper. "Dense low-cost IoT network maps street-level air pollution across Hyderabad." Scienmag. October 17, 2026. https://scienmag.com/dense-low-cost-iot-network-maps-street-level-air-pollution-across-hyderabad/


