


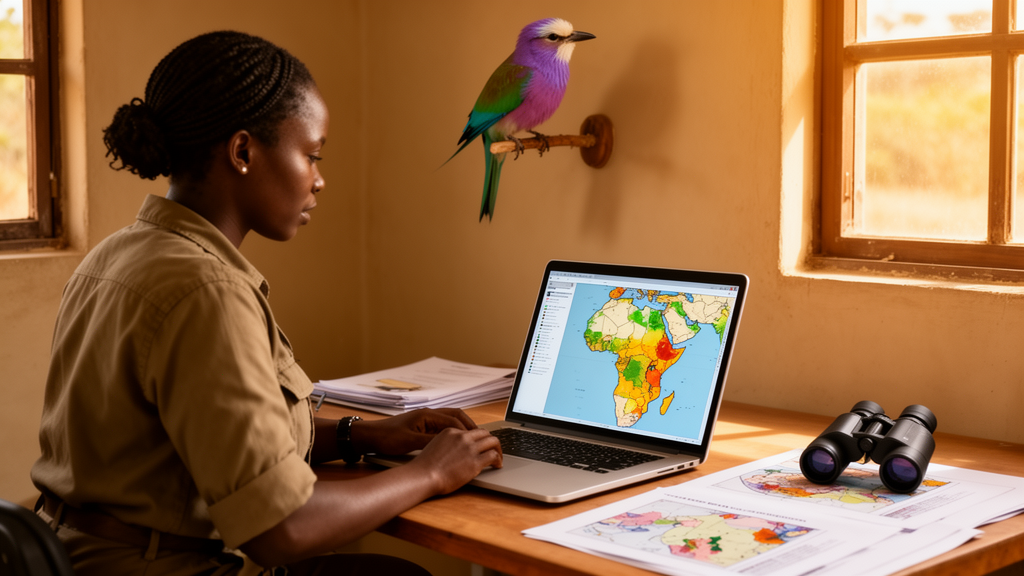
Africa’s birds are now among the most intensively monitored wildlife on Earth, thanks to one of the largest citizen-science biodiversity monitoring initiatives ever attempted. But for the researchers hoping to mine that mountain of data, a frustrating technical wall has long stood in the way: turning raw atlas records into publication-ready maps required hours of manual downloads, data cleaning, and geographic information system processing. A new open-source software tool, described in Frontiers in Bird Science, promises to demolish that wall, transforming what once took days of painstaking work into a task completed in seconds with just a few lines of code.
The tool, called AfriAtlas, was developed by Bello Adamu Danmallam of the A.P. Leventis Ornithological Research Institute at the University of Jos in Nigeria, together with Michael Brooks of the University of Cape Town in South Africa and Ulf Ottosson of APLORI. It is an R package designed specifically to automate the retrieval and visualization of data from the African Bird Atlas Project, or ABAP, an initiative that integrates multiple national bird atlasing programs across the continent, including the Southern African Bird Atlas Project 2, the Kenya Bird Map, and the Nigerian Bird Atlas Project. All of these programs follow a standardized protocol originally developed in South Africa, making their data continentally consistent and directly comparable.
The technical foundation of that consistency is deceptively simple. Volunteers survey grid cells measuring five minutes of latitude by five minutes of longitude, known as pentads, which cover roughly nine by eight kilometers on the ground. Within each pentad, observers follow a fixed protocol, recording every bird species they detect while accumulating survey hours. These vetted citizen-science records, paired with associated effort information, compile into datasets spanning Africa’s remarkably heterogeneous landscapes, from the fynbos of the Cape to the Sahel savannas of West Africa. The coordinated framework enables robust assessments of biodiversity change, including shifts in bird distributions, patterns of local turnover, and long-term population trends, while supporting conservation planning, policy development, and assessments of species patterns across managed and human-modified environments.
Until now, however, exploiting this pentad-scale map data for high-level analysis or publication remained technically demanding. Although the raw atlas data is accessible through the BirdMap web portal, researchers typically had to download GeoJSON files manually, resolve inconsistencies in file structures and naming conventions, obtain matching administrative boundary datasets, and conduct additional GIS processing before any results could be visualized or interpreted within a spatial context. These steps created substantial barriers to efficient and reproducible workflows, particularly for researchers in Africa who may lack access to expensive commercial GIS software or specialized training in spatial data processing.
Several R packages associated with the African Bird Atlas Project already provide important functionality for accessing and processing atlas datasets. Tools such as rabm, ABAP, and ABDtools support data retrieval, environmental annotation, and ecological modeling workflows. The rabm package primarily supports retrieval of atlas records by species, observer, date, and region, including multi-species queries. The ABAP package extends this by supporting retrieval of card-level and pentad-level data and preparation of detection/non-detection datasets for occupancy modeling frameworks such as unmarked and spOccupancy. ABDtools provides integration with Google Earth Engine, enabling extraction and annotation of environmental covariates for ecological analyses. But these packages generally focus on specific analytical components rather than integrated visualization pipelines, leaving a gap for a dedicated tool that standardizes the complete workflow from atlas data acquisition to publication-ready visualization.
AfriAtlas fills that gap with a carefully engineered architecture built on a modern spatial data science dependency stack. The package is released under the MIT License, implemented using the S3 object-oriented system in R, and supports R version 3.5 or later. It draws on sf for standardized vector data handling, ggplot2 for visualization, and rnaturalearth for retrieving up-to-date administrative boundaries, with cowplot and ggspatial supporting final map rendering. The workflow is organized into three logical phases. First, species selection and validation: African Bird Atlas Project species are referenced using numeric codes that can be difficult to locate without appropriate lookup tools, so AfriAtlas provides helper functions that retrieve the code associated with a given scientific or common name and allow users to browse the full species list. Users assemble the results into a species codes vector, which is validated before proceeding, and an internal logic gate ensures that requests do not exceed the recommended batch limit of ten species, promoting efficient data retrieval and preventing excessive API resource consumption.
Second, following validation, the workflow divides into two independent visualization streams, each beginning with a query to the BirdMap API to fetch spatial occurrence and survey effort data. Upon data retrieval, AfriAtlas performs automated spatial processing to align pentad coordinates with national administrative boundaries, dynamically handling the administrative datasets that researchers previously had to source and match manually. The map_coverage function generates standardized survey-effort maps that summarize total hours recorded per pentad and produces accompanying summary statistics, while the map_species function retrieves species-occurrence data and generates species distribution maps by combining occurrence records with survey-coverage information. Third, in the synthesis and export phase, species occurrence and survey coverage outputs are combined to enable interpretation of distribution patterns in the context of sampling effort. Survey effort maps are exported as PNG files along with summary statistics, including the number of pentads per effort category and the mean and standard error of accumulated hours, as CSV files to the working directory. Error handling implemented through R’s tryCatch mechanism allows the workflow to manage temporary API delays without interrupting batch operations, a fault-tolerance feature that proves essential when processing large regions or multiple species.
Perhaps the most distinctive feature of AfriAtlas is a novel metric developed within the package: the Widespreadness Index. This index assists users in interpreting whether a species is broadly distributed or range-restricted within a given region. It is defined as the proportion of full protocol pentads in which a species was recorded, relative to the total number of surveyed full protocol pentads within the defined region, multiplied by 100. By restricting the formula to full protocol pentads, the metric standardizes comparisons by controlling for spatial variation in observer effort. The authors are careful to position it as a coarse, effort-conditioned measure of species widespreadness that is distinct from formal occupancy modeling, which explicitly accounts for imperfect detection, but one that remains informative for broad-scale comparisons of species occurrence patterns.
To demonstrate the versatility of the package, the team applied it to visualize survey effort and species distributions across three major atlas regions: Nigeria, Kenya, and South Africa. The results revealed striking differences in sampling intensity. South Africa showed the highest coverage, with 1,613 pentads receiving between 101 and 999 hours of effort, averaging 281.99 hours, and 249 pentads exceeding 1,000 hours, averaging 2,352.64 hours. Kenya exhibited low-to-moderate sampling, with most coverage concentrated in the two-to-three hour range across 549 pentads and only 7 pentads surpassing 1,000 hours. Nigeria was similarly dominated by low-to-moderate effort categories, including 3,798 pentads with two-to-three hours and 1,548 pentads with four-to-seven hours. These coverage disparities highlight the importance of using effort-corrected metrics when interpreting atlas data, and by automating the retrieval and visualization of effort patterns, AfriAtlas helps account for these biases and supports more reliable cross-regional comparisons.
The package’s utility for conservation and migratory monitoring was evaluated through two ecologically distinct case studies: the Critically Endangered Hooded Vulture and the Palearctic migrant Barn Swallow. The Hooded Vulture showed low Widespreadness Index values across all regions, with Nigerian pentads showing notably low values of just 2.8 percent, a pattern consistent with documented population declines in West Africa associated with poisoning and illegal trade. The Barn Swallow exhibited a clear latitudinal trend: low values of 4.7 percent in Nigeria, moderate values of 54.9 percent in Kenya, and high saturation of 73.0 percent in South Africa, reflecting the species’ expected wintering distributions consistent with known migratory patterns across Africa. These findings demonstrate the value of citizen science in generating large-scale species distribution data and supporting long-term biodiversity monitoring. Before AfriAtlas, producing pentad-level maps required extensive manual processing in desktop GIS software; the workflow is now streamlined into a series of function calls that generate maps within seconds, facilitating rapid biodiversity reporting and reproducible workflows across a range of projects. The authors note that the Widespreadness Index should be interpreted strictly as a descriptive, effort-conditioned indicator rather than a formal estimate of occupancy, since it does not account for imperfect detection, observer heterogeneity, or non-random spatial sampling inherent in citizen-science datasets. Detectability may vary among habitats, with species potentially easier to detect in open landscapes than in dense vegetation, while differences in observer experience across regions may further influence observed patterns. AfriAtlas version 0.1.0 is distributed through GitHub with version-controlled releases supporting transparent development and reproducibility, and because it relies on the BirdMap API for data retrieval, its functionality depends partly on external API structure and availability. As atlas datasets continue to expand across Africa, tools like this will be critical for extracting ecological insights from unevenly sampled landscapes, identifying survey coverage gaps, and lowering the entry barrier for ornithological and conservation research on the continent.
Subject of Research: AfriAtlas: an R package for automating the visualization of African bird atlas project data
Article Title: AfriAtlas: an R package for automating the visualization of African bird atlas project data
Article References: Danmallam, B. A., Brooks, M., & Ottosson, U. (2026). AfriAtlas: an R package for automating the visualization of African bird atlas project data. Frontiers in Bird Science, 5, Article 1765968. https://doi.org/10.3389/fbirs.2026.1765968
Image Credits: AI Generated
DOI: 10.3389/fbirs.2026.1765968
Keywords: AfriAtlas, package, automating, visualization, African, bird, atlas, project, data, scientific research
Cite Scienmag News
Margaret Porter. (October 16, 2026). New R Package Turns Africa’s Vast Bird Atlas Data Into Maps in Seconds. Scienmag. https://scienmag.com/new-r-package-turns-africas-vast-bird-atlas-data-into-maps-in-seconds/
Margaret Porter. "New R Package Turns Africa’s Vast Bird Atlas Data Into Maps in Seconds." Scienmag, 16 October 2026, https://scienmag.com/new-r-package-turns-africas-vast-bird-atlas-data-into-maps-in-seconds/. Accessed 16 October 2026.
Margaret Porter. "New R Package Turns Africa’s Vast Bird Atlas Data Into Maps in Seconds." Scienmag. October 16, 2026. https://scienmag.com/new-r-package-turns-africas-vast-bird-atlas-data-into-maps-in-seconds/


