


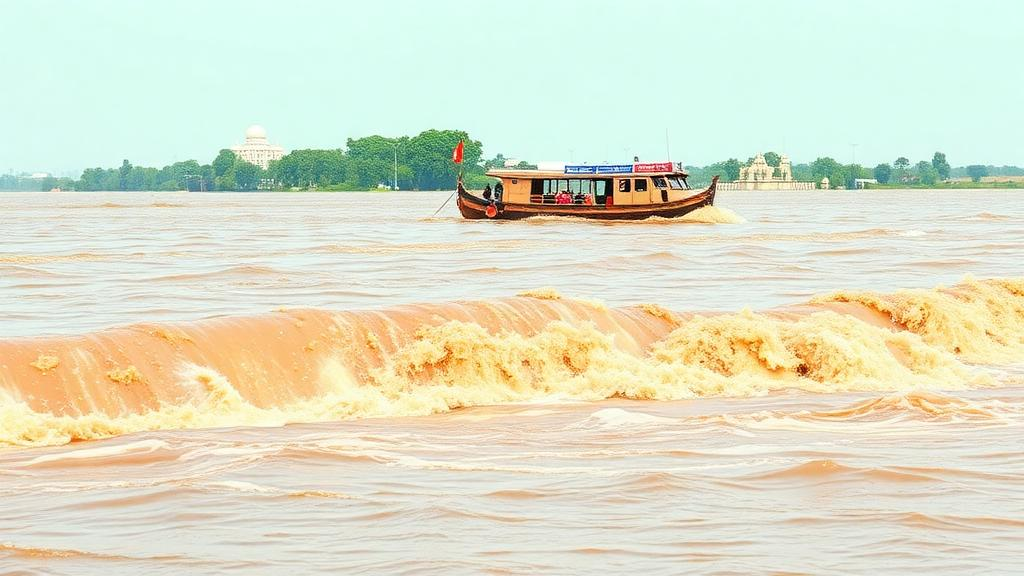
Every monsoon, the Gomati River swells through the heart of Lucknow, the capital of India’s most populous state, and every year engineers, planners and millions of residents ask the same question: how bad could the next flood actually be? A new study published in Discover Geoscience offers the most rigorous statistical answer yet for this stretch of the river. By analysing 43 years of annual peak discharge records collected at the Hanuman Setu gauging station near the University of Lucknow, a team of Indian researchers has identified the probability distribution that best describes the river’s flood behaviour and used it to calculate how much water the Gomati could deliver at recurrence intervals ranging from 2 to 200 years. The results provide hard numbers that can anchor the design of bridges, embankments and barrages in one of the fastest-growing cities of the Ganga Alluvial Plain.
The research, led by Shashwat Verma of the University of Lucknow together with colleagues from Babasaheb Bhimrao Ambedkar University, Jai Narain Vyas University and the Birbal Sahni Institute of Palaeosciences, draws on annual maximum series data from 1969 to 2011 supplied by the Central Water Commission. Flood frequency analysis, the technique at the core of the study, is a statistical framework that links the magnitude of extreme hydrological events to how often they are expected to occur. Rather than treating each flood as an isolated disaster, the method fits probability distributions to historical peak flows, allowing hydrologists to estimate, for example, the discharge expected once every century. Reliable estimates demand long records; the literature generally considers at least 30 years of continuous data necessary, and the 43-year Gomati record comfortably clears that bar.
The raw data reveal a river of dramatic contrasts. The largest flood on record struck on 10 September 1971, when peak discharge reached 3,085 cubic metres per second and the water level climbed to 110.85 metres, roughly five times the arithmetic mean annual peak of 596 cubic metres per second. Contemporary newspaper accounts reported that about one-fifth of Lucknow was submerged under two feet of water, and ten Army boats were deployed for evacuation and relief. At the other extreme, the lowest annual peak, recorded in 1993, was just 83.72 cubic metres per second, seven times below the mean. Five events, in 1971, 1980, 1982, 1985 and 2008, pushed the gauge above the warning level of 108.5 metres, and the Flood Hazard Atlas of Uttar Pradesh documents significant inundation of low-lying Lucknow districts in August 2008.
Statistical descriptors of the record tell an intriguing story. The series shows a high positive skewness of 2.92 and a kurtosis of 9.85, hallmarks of a heavy-tailed distribution in which extreme values are far more likely than a simple bell curve would suggest. The Ljung-Box test confirmed that the annual peaks are independently distributed, with p-values for lags one through five all comfortably above the 0.05 significance level. Running cumulative statistics, however, exposed a hydrological shift: the running mean fell steadily from 905 cubic metres per second in 1985 to 596 by 2011 before stabilising, while running skewness climbed from 1.8 to 2.92. In other words, ordinary peak flows are shrinking, but the upper tail of the distribution, the realm of rare catastrophic floods, is growing heavier, a combination that makes the river deceptively dangerous.
Trend analysis reinforced this picture. The Mann-Kendall test returned a Z statistic of −1.35 with a p-value of 0.18 and Kendall’s tau of −0.14, indicating a decline in annual peak discharge that fails to reach statistical significance at the 0.05 level. Sen’s slope estimator quantified the change at −4.68 cubic metres per second per year, and a percent-change calculation suggested the magnitude of annual peak floods dropped by roughly 34 percent over the observation period. The authors link this decline to land-use and land-cover transformation: expanding agriculture can alter soil structure and increase infiltration, reducing surface runoff during the monsoon. Lucknow’s own growth tells a parallel story of hydrological stress, with built-up area expansion accompanied by the loss of natural water bodies from 24.53 to 15.77 square kilometres and vegetation cover from 434.33 to 211.71 square kilometres between earlier baselines, changes that have degraded groundwater recharge across the basin.
With the data characterised, the team fitted five candidate probability distributions: Gumbel Max, Log-Pearson type III, Lognormal, Normal and Generalised Extreme Value. Parameters for the first four were estimated with the method of ordinary moments, while the GEV used the more robust L-moments approach, which handles outliers well. Skewness-kurtosis plots showed the log-transformed data aligning closely with the Log-Pearson type III distribution, and the L-moment ratio diagram supported the GEV as a strong theoretical contender. Flood magnitudes were then computed for return periods of 2, 5, 10, 25, 50, 100 and 200 years, with the Gumbel Max distribution giving the best estimates for short return periods up to 25 years and the GEV and Log-Pearson type III dominating beyond 50 years.
Choosing the best model required a battery of formal tests. Goodness-of-fit procedures, the Kolmogorov-Smirnov, Anderson-Darling and Chi-square tests, were run at the 95 percent confidence level. The Kolmogorov-Smirnov and Anderson-Darling tests ranked the GEV first, followed by Log-Pearson type III and Lognormal, while rejecting the Gumbel Max and Normal distributions outright; the Chi-square test, acknowledged to have low statistical power, placed Log-Pearson type III first. Probability-probability plots and cumulative and probability density function curves visually confirmed that GEV and Log-Pearson type III traced the observed data most faithfully. The decisive evidence, however, came from accuracy indices. The Nash-Sutcliffe efficiency, which compares model predictions against observed discharges with a perfect score of one, and the root mean square error to observation standard deviation ratio, whose ideal value is zero, both ranked Log-Pearson type III first, ahead of GEV, Lognormal and Gumbel Max, all within the very good performance band.
The verdict matters because the two distributions disagree in a practically important way. While the GEV fits the overall shape of the distribution slightly better in the shape-based tests, Log-Pearson type III proved more accurate in predicting the actual observed discharges, and the authors conclude it is the most reliable model for the Hanuman Setu station. Using this distribution, the estimated flood discharges for return periods of 2, 5, 10, 25, 50, 100 and 200 years come out at 433.7, 805.6, 1147.9, 1715.1, 2253.3, 2907.0 and 3699.1 cubic metres per second respectively. The relationship between observed and predicted peaks is tight, with a coefficient of determination of 0.9433. The recurrence intervals of key reference flows also emerged: the mean annual peak recurs roughly every three years, floods exceeding one standard deviation above the mean about every ten to eleven years, and the record 1971 flood somewhere between 99.55 and 118.22 years depending on the model, with the Lognormal stretching that estimate to 318 years.
These numbers carry immediate engineering significance. The Gomati Barrage, completed in 1979 about 2.5 kilometres upstream of the gauging site, was designed to pass 4,246 cubic metres per second, a figure that comfortably exceeds even the 200-year estimate of 3,699.1 cubic metres per second, suggesting the channel’s carrying capacity at Hanuman Setu remains sufficient. The 100-year discharge of 2,907 cubic metres per second sets a baseline for major structures such as dams and large bridges, the 50-year value of 2,253.3 cubic metres per second suits culverts and smaller infrastructure and embankment planning, and the 200-year figure offers urban planners a benchmark for flood hazard zoning and public safety. The study’s ecological framing matters too: the river requires a minimum flow of 55 cubic metres per second, about a third of its mean annual discharge, to sustain aquatic life, and riverine floods, for all their destructiveness, deposit fertile sediments and recharge aquifers across a basin where roughly 76 percent of the land is farmed.
The authors are candid about the limits of their work. The record ends in 2011 and so may not capture the most recent hydro-climatological shifts; the analysis excludes anthropogenic drivers such as rapid urbanisation and industrial development; and no climate change projections are incorporated, meaning potential non-stationarity in extreme flows goes unmodelled. Their roadmap for the future is ambitious: coupling the Log-Pearson type III quantiles with a one- and two-dimensional HEC-RAS hydrodynamic model to produce high-resolution flood inundation maps, testing more flexible three- and four-parameter distributions such as the Wakeby, and building multivariable correlations between hydrological extremes, climate indices and human activity indicators. For now, the study delivers something Lucknow has lacked: a statistically validated, station-specific flood forecast that translates four decades of river memory into concrete design numbers, and a warning that even as the Gomati’s ordinary floods fade, its capacity for catastrophe has not.
Subject of Research: Flood frequency analysis of annual peak discharge on the Gomati River at Lucknow, India
Article Title: Flood frequency analysis of Gomati River at Lucknow, Ganga Alluvial Plain, India
Article References: Verma, S., Kumar, S., Singh, P., Singh, S., Kar, R., & Singh, M. (2026). Flood frequency analysis of Gomati River at Lucknow, Ganga Alluvial Plain, India. Discover Geoscience, 4(1), Article 295. https://doi.org/10.1007/s44288-026-00666-4
Image Credits: AI Generated
DOI: 10.1007/s44288-026-00666-4
Keywords: flood frequency analysis, Gomati River, Lucknow, Log-Pearson type III, Gumbel Max, Generalised Extreme Value, Mann-Kendall test, annual maximum series, Ganga Alluvial Plain, return period, goodness of fit, hydrology
Cite Scienmag News
Violet Maxwell. (October 11, 2026). Statistical Model Pinpoints How Big Lucknow’s Next Great Gomati Flood Could Get. Scienmag. https://scienmag.com/statistical-model-pinpoints-how-big-lucknows-next-great-gomati-flood-could-get/
Violet Maxwell. "Statistical Model Pinpoints How Big Lucknow’s Next Great Gomati Flood Could Get." Scienmag, 11 October 2026, https://scienmag.com/statistical-model-pinpoints-how-big-lucknows-next-great-gomati-flood-could-get/. Accessed 11 October 2026.
Violet Maxwell. "Statistical Model Pinpoints How Big Lucknow’s Next Great Gomati Flood Could Get." Scienmag. October 11, 2026. https://scienmag.com/statistical-model-pinpoints-how-big-lucknows-next-great-gomati-flood-could-get/


