


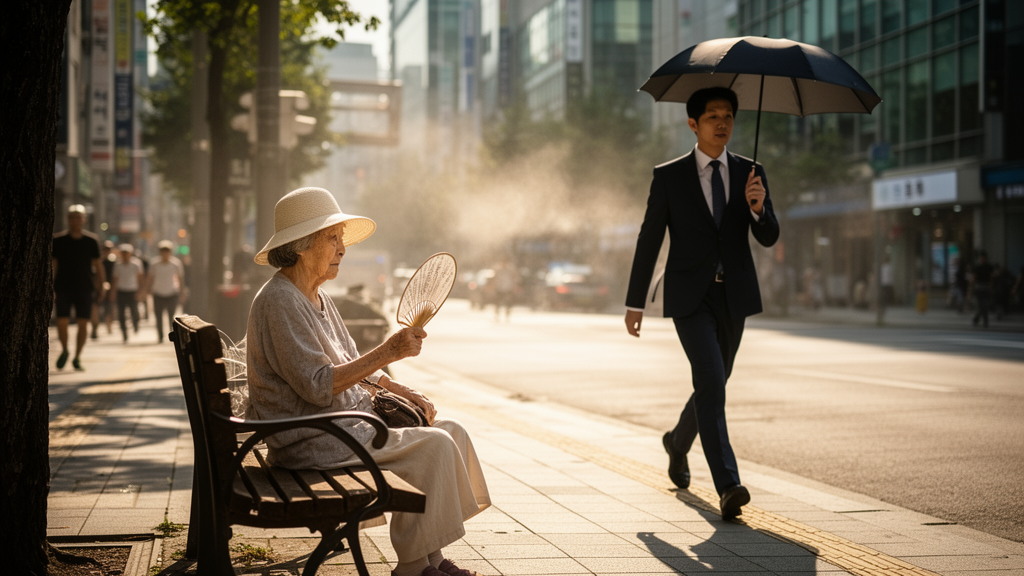
When a heatwave bears down on a country, the deaths and illnesses that follow are never distributed evenly. They cluster among the elderly, the poor, the socially isolated, and those whose jobs or housing leave them nowhere to hide from the heat. But a deceptively simple question has long haunted the research literature: when health outcomes differ between hotter and cooler regions, is that because the people living in those regions are different, or because the places themselves impose different burdens? A new study from South Korea offers one of the most structured answers to date, and its conclusion is striking: the answer depends entirely on which kind of health you are measuring.
The research, published in the International Journal of Disaster Risk Science by Chaeyeon Lee and Donghyun Kim of Pusan National University, analyzed nationally representative survey data from 2010, 2015, and 2019, combining individual health records with municipal-level climate data from the Korea Meteorological Administration. Rather than imposing a fixed temperature threshold to define which regions counted as heat-exposed, the authors used k-means clustering, a machine learning technique that partitions regions into two groups based on the actual distribution of heatwave days and tropical nights in each year. This relative classification matters. Heatwave day counts vary substantially from year to year, and no agreed-upon normative benchmark exists for how many hot days should define a heat-exposed region. By letting the data define the groups annually, the researchers avoided the arbitrariness of a fixed cutoff and captured the year-specific geography of heat exposure across South Korea’s municipal districts.
The study’s second methodological innovation lies in how it treats health itself. Most heatwave research focuses on a single outcome, either clinical measures such as mortality and diagnosed disease, or experience-based measures such as self-rated health and quality of life. Lee and Kim deliberately examined both. Objective health was operationalized as whether a respondent had ever been diagnosed with hypertension by a physician, a prevalent cardiovascular condition known to be sensitive to heat stress through pathways including dehydration, increased heart rate, and hemoconcentration. Subjective health came from a standard five-point self-rating question, with responses of very good, good, or fair coded as healthy. Self-rated health is far more than a soft measure; decades of public health research show it predicts future health deterioration and mortality risk, and it captures dimensions of well-being, including sleep disruption, stress, and psychological distress, that clinical diagnoses miss.
The individual-level data came from the Korea Community Health Survey, conducted annually by the Korea Disease Control and Prevention Agency, which provided a rich set of covariates: age, sex, education, household income, receipt of basic livelihood support, marital status, occupation, smoking and drinking history, weekly walking time, sleep duration, and urban residence. The authors estimated logistic regression models for each health outcome in each year, then applied a nonlinear extension of the Blinder-Oaxaca decomposition, a technique borrowed from labor economics that splits the average health gap between two groups into an explained component, attributable to differences in observable characteristics, and an unexplained component, reflecting structural or contextual differences that persist even when individuals have identical attributes.
The descriptive findings already contained a surprise. Residents of high-heat-exposure regions actually reported better subjective health and lower hypertension prevalence than residents of low-exposure regions in every year studied. The gap in subjective health grew from 0.8 percentage points in 2010 to 4.7 percentage points in 2019, and the objective health gap widened from 2.0 to 4.8 percentage points over the same period. The explanation lies in who lives where: people in the hotter regions tended to be younger, more educated, and wealthier, with fewer agricultural workers, while the cooler regions housed older, more rural populations. Heat exposure, in other words, is not a simple proxy for disadvantage in South Korea’s geography.
The decomposition results then delivered the study’s central insight. For subjective health, more than 90 percent of the gap between high- and low-exposure regions was explained by observed individual characteristics in every single year. In 2010, the characteristic effect accounted for 103.7 percent of the gap; in 2015, 103.4 percent; and in 2019, 92.6 percent. Values exceeding 100 percent mean that if the two populations had identical characteristics, the gap would not merely shrink but reverse direction. The dominant contributors were age, educational attainment, and household income. In 2010, age alone explained 72 percent of the subjective health gap; by 2015 and 2019, education had become the largest single factor, followed by age and income. The message is unambiguous: how healthy people feel in heat-exposed regions is overwhelmingly a function of their socioeconomic resources, not the heat itself.
Objective health told a fundamentally different story. In 2010, only 46 percent of the hypertension gap was explained by observable characteristics, leaving more than half unexplained. In 2015, the explained share rose to 57.7 percent, still leaving a substantial 42.3 percent unaccounted for. Only in 2019 did the explained component reach 105 percent, effectively closing the gap. Across most of the study period, then, a large portion of the difference in clinically diagnosed health between hot and cool regions persisted even after accounting for who lived there. The authors interpret this unexplained component as evidence of structural and environmental constraints tied to place: differences in healthcare access, information asymmetry, and opportunity structures that prevent individuals with similar resources from converting those resources into realized health outcomes. Supporting this interpretation, the study found significant differences in hospital bed availability and urbanization rates between the two exposure groups.
The logistic regressions added texture to these patterns. For subjective health, education, income, walking time, sleep duration, and employment were consistently protective, while basic livelihood recipients and people with a smoking history fared worse. For objective health, occupation mattered in ways self-rated health did not capture: managers, craft and related trade workers, plant and machine operators, and those in elementary occupations were all more likely to have been diagnosed with hypertension. The authors point to occupational risk factors documented in prior research, including intense job stress, long or shift-based working hours that disrupt circadian rhythms, exposure to metals and metalloids, physical strain, and occupational noise. These findings suggest that the workplace is a critical and underappreciated arena where heat vulnerability and cardiovascular risk intersect.
Why does this matter beyond South Korea? The study offers a compelling resolution to a long-standing contradiction in the heatwave literature. Some studies report sharp increases in mortality and disease during extreme heat events, while others find these effects attenuating over time as populations and institutions adapt. Lee and Kim’s results suggest that such inconsistencies may partly reflect differences in the health indicators chosen. Perceived health appears to be resource-dependent, moving with socioeconomic endowments, while clinically realized health appears more context-dependent, shaped by the structural conditions of the places where people live. A literature that mixes these outcomes without distinction will inevitably produce mixed findings.
The policy implications are equally two-pronged. Because subjective health disparities track individual characteristics so closely, interventions that improve socioeconomic position, including education, income support, and health literacy, could substantially narrow how heat-related health inequality is experienced. But because objective health disparities carry a large unexplained component, individual-level measures alone will not suffice. Regional investments in healthcare infrastructure, cooling access, and the environmental conditions of vulnerable places are needed to ensure that comparable personal resources translate into comparable physical health outcomes. The authors are candid about limitations: hypertension alone cannot represent the full spectrum of objective health, the relative annual classification of exposure precludes direct year-to-year trend analysis, and self-reported measures carry response bias. Yet as climate change intensifies heatwaves across East Asia and beyond, this study provides something the field has lacked, a rigorous statistical framework for asking not just whether heat divides populations, but exactly where along the chain from personal circumstance to place-based structure that division takes hold.
Subject of Research: Regional health disparities between high- and low-heatwave-exposure regions in South Korea, decomposed into explained and unexplained components for subjective and objective health outcomes
Article Title: Decomposing Regional Health Disparities Under Heatwave Exposure: Evidence from South Korea
Article References: Lee, C., & Kim, D. (2026). Decomposing Regional Health Disparities Under Heatwave Exposure: Evidence from South Korea. International Journal of Disaster Risk Science. https://doi.org/10.1007/s13753-026-00775-1
Image Credits: AI Generated
DOI: 10.1007/s13753-026-00775-1
Keywords: heatwave, health disparities, South Korea, Blinder-Oaxaca decomposition, self-rated health, hypertension, k-means clustering, environmental health, social inequality, climate change, public health, heat exposure
Cite Scienmag News
Denise Maddox. (October 9, 2026). Who Really Suffers in a Heatwave? South Korean Study Splits Health Gaps into Two Very Different Stories. Scienmag. https://scienmag.com/who-really-suffers-in-a-heatwave-south-korean-study-splits-health-gaps-into-two-very-different-stories/
Denise Maddox. "Who Really Suffers in a Heatwave? South Korean Study Splits Health Gaps into Two Very Different Stories." Scienmag, 9 October 2026, https://scienmag.com/who-really-suffers-in-a-heatwave-south-korean-study-splits-health-gaps-into-two-very-different-stories/. Accessed 9 October 2026.
Denise Maddox. "Who Really Suffers in a Heatwave? South Korean Study Splits Health Gaps into Two Very Different Stories." Scienmag. October 9, 2026. https://scienmag.com/who-really-suffers-in-a-heatwave-south-korean-study-splits-health-gaps-into-two-very-different-stories/


