


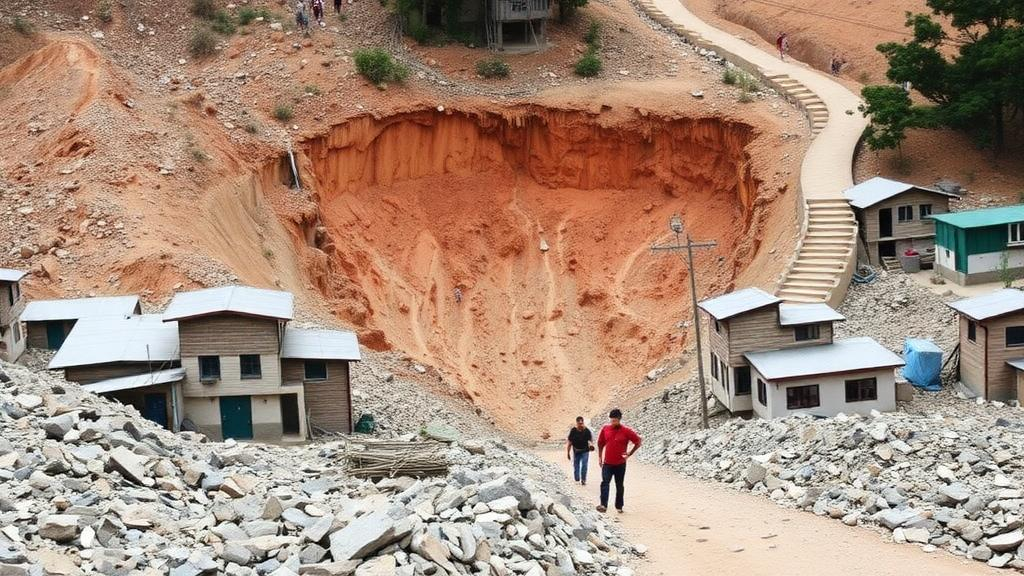
In the crowded hill town of Srinagar in Uttarakhand, where the Alaknanda River cuts through the tectonically restless Lesser Himalaya, the ground beneath homes, roads and markets is far less stable than it looks. A new study has produced some of the most detailed landslide hazard, vulnerability and risk maps ever assembled for this rapidly urbanising municipality, combining two statistical modelling techniques in a geographic information system with old-fashioned fieldwork on the slopes themselves. The result is a set of maps that show, block by block, where the next slope failure is most likely to strike and where people and infrastructure stand to suffer the most.
The research, published in the journal Discover Geoscience by Mohd Shuaib and Vikas Pratap Singh of the Civil Engineering Department at the National Institute of Technology Uttarakhand, addresses a persistent gap in Himalayan hazard science. Most previous landslide assessments in the region have been carried out at broad state or district scales or confined to highway corridors, leaving fast-growing towns without the fine-grained information planners need. The new work goes further than most by integrating not just hazard, but also vulnerability and risk, and by validating its predictions against both statistical tests and geomechanical observations in the field.
The stakes are high. Landslides account for roughly nine percent of natural disasters worldwide, killing thousands of people each year and causing property damage estimated at around four billion US dollars annually. India bears about eight percent of global landslide fatalities, and of the country’s approximately 0.42 million square kilometres of landslide-prone terrain, some 0.31 million square kilometres lie within the Himalayas. Uttarakhand has endured a string of catastrophic events in recent decades, including the 2003 Varunavat Parvat landslide in Uttarkashi, the 2013 Kedarnath disaster, the 2021 Rishiganga tragedy in Chamoli and the 2025 Dharali landslides. In 2025 alone, monsoon-driven subsidence and landslides damaged houses built on steep slopes in Srinagar itself, many of them constructed without geotechnical assessment or proper drainage.
To build their hazard maps, the researchers compiled an inventory of 58 historical landslide events from the Geological Survey of India’s Bhukosh portal and analysed their spatial relationships with eleven conditioning factors: slope angle, aspect, elevation, profile curvature, distance to streams, distance to roads, distance to faults, lithology, the stream power index, rainfall and land use and land cover. Data came from a 30-metre digital elevation model obtained through the USGS Earth Explorer platform, GSI geological layers, rainfall grids from the Climatic Research Unit, and Sentinel-2 land cover data resampled to match the resolution of the other layers. The landslide inventory was split randomly, with 70 percent of the events used to train the models and the remaining 30 percent reserved for independent validation.
Two bivariate statistical methods formed the analytical core of the study. The frequency ratio model compares the proportion of landslides falling within each class of a conditioning factor against the proportion of the study area that class occupies, yielding values above one where landslides cluster more densely than chance would predict. The information value model applies a logarithmic transformation to the same relationship, stabilising variance and dampening the influence of extreme values in unevenly distributed classes. Because the information value approach is essentially a normalised version of the frequency ratio, running both models allowed the team to cross-check their hazard zonation and quantify the uncertainty that comes with any single statistical method.
The factor analysis revealed clear patterns in where and why slopes fail. Slopes steeper than 45 degrees recorded the highest frequency ratio of any slope class at 6.47, reflecting the greater gravitational stress and reduced shear strength on near-vertical terrain. Areas within 50 metres of roads showed a frequency ratio of 3.04, a signature of the slope cutting, excavation and vegetation removal that accompany mountain road construction. Zones within 250 metres of streams registered a ratio of 2.44, pointing to fluvial undercutting and toe erosion, while the 500-to-1,500-metre band around faults scored 2.80, a consequence of the fractured and weakened rock produced by tectonic activity. Perhaps most strikingly, hard igneous rocks yielded the highest lithological ratio at 7.51, which the authors attribute to intense fracturing and weathering that enable structurally controlled failures even in otherwise strong rock. When the factors were ranked by their overall predictive weight, lithology dominated with a prediction ratio of 4.554, followed by distance to faults, distance to streams, elevation and slope.
The two hazard maps told somewhat different stories about how much of the region is in danger. The frequency ratio model classified 18.88 percent of the area, or 13.14 square kilometres, as high hazard and 4.87 percent, or 3.39 square kilometres, as very high hazard, with the moderate class covering the largest share at 28.68 percent. The information value model drew a more alarming picture, placing 28.66 percent of the territory in the high hazard class and 16.02 percent, some 11.15 square kilometres, in the very high category, for a combined 44.68 percent of the landscape flagged as dangerous. The discrepancy suggests the information value model is more sensitive to the critical conditioning factors, a difference the authors treat as informative rather than contradictory, since both models converge on the same underlying controls: steep slopes, fractured rock, and proximity to streams, roads and faults.
Hazard alone does not determine disaster, and the vulnerability assessment brought human exposure into the equation. Using an index overlay approach, the researchers combined population density, distance to roads and land cover into a composite vulnerability index, weighting built-up areas, dense infrastructure and crowded settlements most heavily. The results showed that most of the study area, 58.37 percent, falls into the low vulnerability class, with high and very high vulnerability confined to 8.27 percent and 1.28 percent of the terrain respectively. These exposed hotspots cluster along road corridors, around settlements and across sparsely vegetated rangelands where slope modifications have destabilised the ground. Multiplying the vulnerability index by each hazard index produced the final risk maps, which identified 21.14 percent of the area as high risk and 3.71 percent as very high risk under the frequency ratio model, and 18.65 percent and 4.33 percent respectively under the information value model.
Statistical validation confirmed the models’ competence, but the most convincing evidence came from the field. Receiver operating characteristic analysis showed success rate areas under the curve of 0.827 for the frequency ratio model and 0.885 for the information value model, while independent prediction rates reached 0.734 and 0.783 respectively, figures consistent with comparable Himalayan studies. More importantly, the team visited landslide sites within the mapped high and very high risk zones, where large rock blocks had to be removed from roadways to restore traffic, and performed a kinematic analysis of a vulnerable slope using discontinuity orientation data from joint sets, bedding planes and the slope face. The stereonet analysis placed the slope inside the critical failure envelope and identified a wedge failure mode between two joint sets whose line of intersection plunges toward the slope face at an angle shallower than the slope dip. This structurally controlled failure mechanism, observed on the ground exactly where the models predicted the greatest danger, provides a rare and rigorous ground-truth check that most statistical hazard studies lack.
The authors are careful to frame the work as a preliminary but robust foundation rather than a final word. They suggest that future research should explore artificial intelligence and machine learning techniques to push predictive accuracy higher, and that detailed site-specific investigations using numerical slope stability modelling, combined with real-time monitoring, could underpin early warning systems for the region. For now, the maps offer town planners and disaster managers in Srinagar something they have never had before: a micro-scale, field-verified picture of where landslides are most likely, where people are most exposed, and where mitigation, land-use regulation and infrastructure investment should be concentrated first. As Himalayan towns continue to grow up steep and fractured slopes under intensifying monsoon rainfall, the framework demonstrated here, pairing GIS-based statistics with geomechanical field validation, offers a cost-effective template that other landslide-prone mountain communities around the world can adapt.
Subject of Research: Integrated landslide hazard, vulnerability and risk mapping in the Srinagar region of Uttarakhand, Lesser Himalayas
Article Title: Integrated landslide hazard, vulnerability, and risk mapping in Srinagar region of Uttarakhand, Lesser Himalayas
Article References: Integrated landslide hazard, vulnerability, and risk mapping in Srinagar region of Uttarakhand, Lesser Himalayas. (n.d.). https://doi.org/10.1007/s44288-026-00690-4
Image Credits: AI Generated
DOI: 10.1007/s44288-026-00690-4
Keywords: landslide hazard, vulnerability mapping, risk assessment, frequency ratio, information value model, GIS, Uttarakhand, Lesser Himalaya, kinematic analysis, ROC-AUC validation, urbanisation, slope stability
Cite Scienmag News
Violet Maxwell. (October 8, 2026). Scientists Map Landslide Danger in a Fast-Growing Himalayan Town. Scienmag. https://scienmag.com/scientists-map-landslide-danger-in-a-fast-growing-himalayan-town/
Violet Maxwell. "Scientists Map Landslide Danger in a Fast-Growing Himalayan Town." Scienmag, 8 October 2026, https://scienmag.com/scientists-map-landslide-danger-in-a-fast-growing-himalayan-town/. Accessed 8 October 2026.
Violet Maxwell. "Scientists Map Landslide Danger in a Fast-Growing Himalayan Town." Scienmag. October 8, 2026. https://scienmag.com/scientists-map-landslide-danger-in-a-fast-growing-himalayan-town/


