


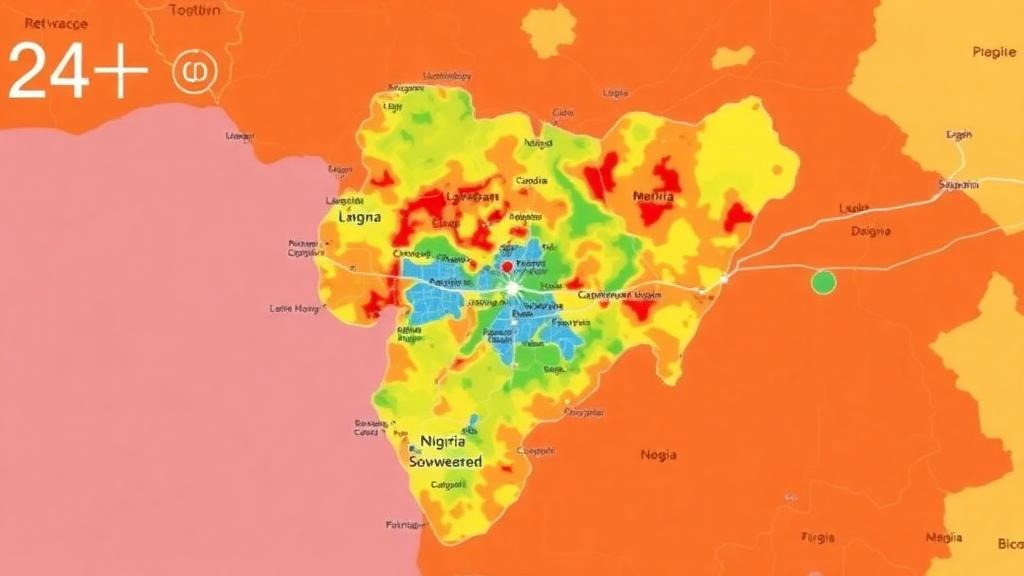
In the riverine city of Makurdi, capital of Nigeria’s Benue State, the question of where the next flood will strike is not an abstract one. Each rainy season, between April and October, the River Benue swells and low-lying neighborhoods such as Wadata and Wurukum find themselves under water, with residents displaced, property destroyed, and water sources contaminated. Now, a team of civil engineering researchers at Joseph Sarwuan Tarka University has produced one of the most detailed flood susceptibility maps ever attempted for the metropolis, using a combination of satellite data, terrain analysis, and a structured expert-judgment technique known as the Analytical Hierarchy Process. Their results, published in the journal Discover Geoscience, suggest that nearly the entire city—more than 94 percent of its land area—falls within moderate, high, or very high flood susceptibility zones, a finding with stark implications for urban planning in one of West Africa’s most flood-exposed cities.
The study, led by Oloche Robert Ekwule with colleagues Gariel Delian Akpen and Matthew Igbalumun Aho, set out to address a persistent gap in Nigerian flood research: earlier assessments of Makurdi had relied on relatively small sets of environmental factors and, critically, had rarely validated their predictions against independent records of where floods actually occurred. The new work integrated ten distinct flood-conditioning factors, drawing on freely available satellite products that have transformed what is possible in data-scarce regions. A 30-meter Digital Elevation Model from NASA’s ASTER instrument supplied the terrain backbone, yielding elevation, slope, drainage density, distance to streams, topographic wetness index, curvature, and geomorphological classes. Landsat 8 imagery provided vegetation density through the Normalized Difference Vegetation Index, while a 10-meter land-cover product derived from Sentinel-2 data captured the patchwork of built-up areas, cropland, trees, rangeland, bare ground, and water bodies across the city.
Rainfall, the climatic engine of flooding, was handled with particular care. The researchers obtained long-term mean annual rainfall data covering 1991 to 2021 from a global climate database, then adjusted those values for elevation using a century-old empirical relationship known as the Schreiber method, which assumes precipitation increases systematically with altitude—roughly 54 millimeters per 100 meters of elevation gain in this formulation. Five hundred randomly placed sampling points across the metropolis received these elevation-corrected values, which were then interpolated into a continuous rainfall surface using the Inverse Distance Weighted technique. The resulting map showed rainfall ranging from about 958 to 1033 millimeters across the study area, a modest spatial gradient but one that nonetheless contributes to differential runoff generation across the city’s low-relief landscape.
The heart of the method lies in the Analytical Hierarchy Process, a multi-criteria decision-making framework developed by mathematician Thomas Saaty. Rather than letting a statistical algorithm discover weights from data, AHP asks experts to compare every pair of factors and judge their relative importance on a scale from one to nine, where one means equal importance and nine means extreme dominance. For ten factors, that means forty-five pairwise judgments, which are assembled into a matrix and normalized by dividing each element by its column sum and averaging across rows. The resulting priority vector assigned elevation the largest share of influence at 19.43 percent, followed closely by slope at 18.21 percent, distance to streams at 14.22 percent, and drainage density at 13.43 percent. Precipitation received 8.73 percent, land use and land cover 8.25 percent, the topographic wetness index 6.98 percent, vegetation index 4.89 percent, geomorphology 3.34 percent, and curvature just 2.52 percent.
Because expert judgments can be internally contradictory, AHP includes a built-in consistency check. The researchers computed the principal eigenvalue of their comparison matrix at 10.71, derived a Consistency Index of 0.0785, and divided it by Saaty’s Random Index of 1.49 for ten criteria, yielding a Consistency Ratio of 0.0527. Since values below 0.10 are considered acceptably consistent, the weighting scheme passed the test, meaning the experts’ pairwise comparisons were logically coherent enough to trust. The weighted factors were then combined through a GIS-based weighted overlay, producing a composite Flood Susceptibility Index for every 30-meter pixel in the metropolis, which was classified into four categories from low to very high susceptibility.
The spatial pattern that emerged is dominated by geography. Moderate susceptibility covers the largest share of the city at 66.13 percent, or 546 square kilometers, reflecting the transitional landscapes where terrain and hydrology are intermediate. High susceptibility zones account for 27.81 percent, while very high susceptibility—though covering only 5.96 square kilometers, or 0.72 percent of the area—is concentrated precisely where it matters most: along the River Benue floodplain and the adjacent low-lying communities that sit on terrain between 62 and 89 meters above sea level. Only 44 square kilometers, about 5 percent of the city, qualified as low susceptibility, and those areas lie in the elevated, well-drained peripheral uplands. The physical logic is straightforward: Makurdi’s terrain is predominantly gentle, with slopes of zero to six degrees near the river corridors, which promotes slow runoff, prolonged water accumulation, and overbank flooding when the Benue and its tributaries overflow.
Several of the thematic layers tell a story about how human activity reshapes flood risk. The land-cover analysis showed that built-up areas and cropland exhibit relatively high susceptibility because impervious surfaces and disturbed soils reduce infiltration and accelerate runoff, while areas dominated by trees and dense vegetation received lower ratings because canopy interception and root systems slow water movement and enhance soil absorption. The Normalized Difference Vegetation Index, calculated from the near-infrared and red bands of Landsat 8 and ranging from minus 0.166 to 0.549 across the city, confirmed this inverse relationship: sparser vegetation correlated with greater vulnerability. Meanwhile, the topographic wetness index, which combines upstream contributing area with local slope in a logarithmic formula, ranged from 3.88 to 24.47, with the highest values clustering in the central low-lying portions of the city where runoff converges and drainage is naturally poor.
Perhaps the most important methodological advance is the validation. The researchers assembled an independent binary dataset of 30 reference points—17 documented flood occurrences recorded between 2012 and 2022, obtained from the Benue State Emergency Management Agency, and 13 randomly selected non-flood locations. Crucially, none of these points were used in the weighting, reclassification, or overlay stages; they were reserved exclusively to test the finished map. Overlaying the points on the susceptibility zones and performing Receiver Operating Characteristic analysis produced an Area Under the Curve of 0.94, a score above the 0.90 threshold generally interpreted as excellent discrimination between flood-prone and non-flood-prone ground. The authors are candid about the limitation, however: with only 30 validation points, the result demonstrates strong discriminatory capability for the available data, but larger independent inventories and complementary uncertainty analyses would provide additional confidence in the model’s robustness.
The broader significance of the study extends well beyond Makurdi. In an era when machine learning methods such as Random Forest, Support Vector Machines, and XGBoost dominate the flood-susceptibility literature, the researchers argue that the GIS–AHP approach remains highly suitable for urban flood studies in regions where reliable hydrological records are limited and expert-based spatial evaluation is essential. The method is transparent—every weight can be traced to an explicit judgment and checked for consistency—and it runs on freely available satellite data, making it replicable in other flood-prone cities across sub-Saharan Africa where rapid, unplanned urbanization, blocked drainage channels, and encroachment into natural floodplains are steadily amplifying flood losses. Nigeria has endured devastating national flood events in 2012, 2020, 2022, and 2024, and climate-driven extreme rainfall is intensifying the hazard.
For Makurdi’s planners, the map is a practical decision-support tool. It identifies, at 30-meter resolution, which neighborhoods warrant drainage investment, which developments should be restricted, and where early-warning and evacuation resources should be pre-positioned before the next wet season peaks. The finding that very high susceptibility hugs the River Benue floodplain is hardly surprising to residents of Wadata or Wurukum, but quantifying it—and validating the quantification against a decade of recorded floods—converts lived experience into evidence that can guide policy. As the authors note, the framework can be adapted to other riverine cities with similar environmental characteristics, offering a template for turning open satellite data and structured expert judgment into actionable flood-risk intelligence for the places that need it most.
Subject of Research: GIS and Analytical Hierarchy Process modelling of flood susceptibility in Makurdi Metropolis, Nigeria
Article Title: Integrated GIS–AHP modelling for flood susceptibility assessment in Makurdi Metropolis, Nigeria
Article References: Ekwule, O. R., Akpen, G. D., & Aho, M. I. (2026). Integrated GIS–AHP modelling for flood susceptibility assessment in Makurdi Metropolis, Nigeria. Discover Geoscience, 4(1), Article 338. https://doi.org/10.1007/s44288-026-00714-z
Image Credits: AI Generated
DOI: 10.1007/s44288-026-00714-z
Keywords: flood susceptibility, GIS, Analytical Hierarchy Process, Makurdi, River Benue, Nigeria, remote sensing, digital elevation model, ROC-AUC validation, urban flooding, land use land cover, weighted overlay analysis
Cite Scienmag News
Violet Maxwell. (October 5, 2026). Mapping Flood Danger: Simple GIS Model Predicts Where Nigerian City Will Drown. Scienmag. https://scienmag.com/mapping-flood-danger-simple-gis-model-predicts-where-nigerian-city-will-drown/
Violet Maxwell. "Mapping Flood Danger: Simple GIS Model Predicts Where Nigerian City Will Drown." Scienmag, 5 October 2026, https://scienmag.com/mapping-flood-danger-simple-gis-model-predicts-where-nigerian-city-will-drown/. Accessed 5 October 2026.
Violet Maxwell. "Mapping Flood Danger: Simple GIS Model Predicts Where Nigerian City Will Drown." Scienmag. October 5, 2026. https://scienmag.com/mapping-flood-danger-simple-gis-model-predicts-where-nigerian-city-will-drown/


