


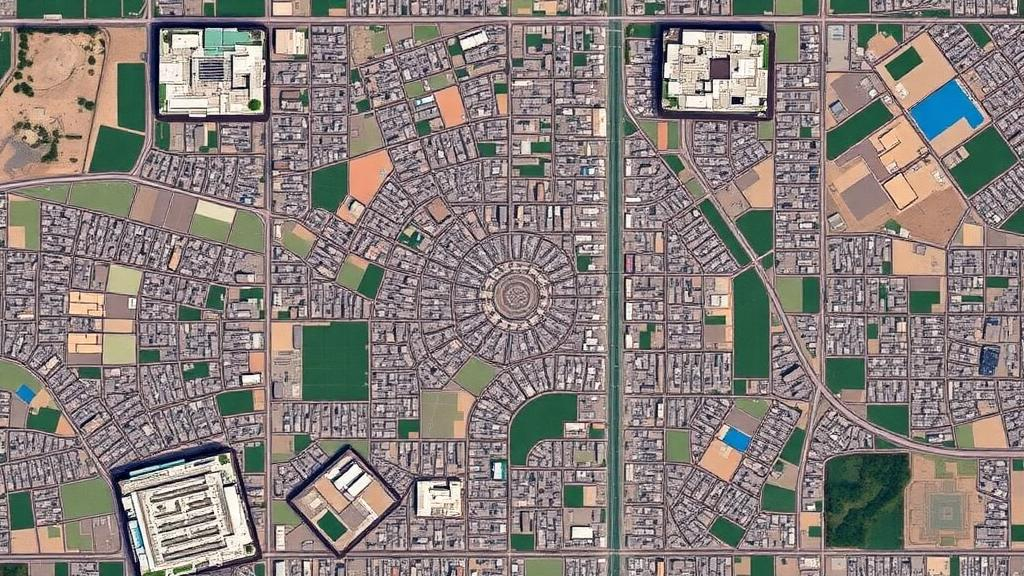
Lucknow, the capital of India’s most populous state, is running out of a resource that most residents never think about until it is gone: land. A new study published in Discover Geoscience has quantified, ring by ring and road by road, just how large the gap is between the residential land the city needs and the land it actually has. Using three decades of satellite imagery and national planning standards, researcher Gaurav Kumar Mishra of Guru Gobind Singh Indraprastha University found disparities of roughly 29.4 to 41.68 percent between required and existing residential land across the zones analyzed, a shortfall that underscores the urgent need for regulatory intervention in one of the fastest-growing cities of northern India.
The research tackles a problem that has long frustrated urban planners: housing shortages in Indian cities are widely acknowledged, but the actual land area needed to close them has been remarkably difficult to compute. The study addresses this by combining two very different data streams. The first comes from the Landsat satellite program, whose multispectral images for 1991, 2001, 2011, and 2021 were downloaded from the United States Geological Survey’s Earth Explorer platform and processed into land-use and land-cover maps. The second comes from the Global Human Settlement Layer, a European Commission dataset that maps population in 100-meter grid cells, allowing population density to be calculated for any spatial unit the analyst chooses.
The technical workflow is a showcase of modern geospatial analysis. Each Landsat scene was pre-processed with geometric and radiometric correction, rectified to the Universal Transverse Mercator coordinate system, and cleaned of cloud-contaminated pixels before classification. The images were then classified using K-means clustering, an unsupervised algorithm that groups spectrally similar pixels into distinct categories. The number of clusters was selected with the elbow method, which plots the within-cluster sum of squares against candidate cluster counts and identifies the point where improvement levels off. The final maps distinguished four classes: built-up land, vegetation, water bodies, and other land. Accuracy assessment against Google Earth reference imagery produced overall accuracies of 87 to 90 percent and Kappa coefficients between 0.83 and 0.89, figures that indicate strong classification reliability across all four decades.
What makes the study distinctive is its spatial framing. Rather than treating Lucknow as a single blob of statistics, Mishra divided the entire 1,220-square-kilometer study area into eight concentric rings, each one kilometer wide, radiating outward from Hazratganj, the city’s Central Business District. This approach echoes classic urban theory, from Burgess’s Concentric Zone Model to density gradient theory, which holds that population density declines with distance from the center. In a second analysis, the city was sliced into three one-kilometer offsets on each side of its primary road network, testing the idea that transportation corridors act as catalysts for sprawl. The same land-cover maps and population data were then overlaid onto both sets of zones, allowing a direct comparison of how proximity to the urban core versus proximity to highways shapes land consumption.
The temporal results tell a dramatic story of transformation. Built-up area barely moved between 1991 and 2001, creeping from 102.95 to 103.26 square kilometers, but then nearly tripled between 2001 and 2021, surging to 283.81 square kilometers. Over the same later period, the category of other open land collapsed from 986.93 to 374.87 square kilometers. Interestingly, vegetation expanded from 126.01 to 555.46 square kilometers and water bodies grew slightly, a pattern the study links to land-use shifts and conservation efforts within the region. The explosive growth of concrete coincided with the two decades in which India’s urban economy liberalized and rural-to-urban migration accelerated, and the study identifies population explosion, migration, rising land values, and infrastructure-led development as the principal drivers of conversion.
The statistical core of the paper lies in linking people to pavement. A linear regression with built-up area as the dependent variable and population density as the independent variable produced a strong positive correlation of R equal to 0.892, explaining 79.6 percent of the variance. The fitted equation, population density equals 3,796.56 plus 23.60 times built-up area, quantifies how each unit of urban expansion accompanies rising population concentration. The author is candid about the model’s limits: with only four temporal data points, the F statistic of 7.81 yields an approximate p-value of 0.11, so the relationship is not statistically significant at the 95 percent confidence level, even though the trend is practically meaningful. A bivariate Moran’s I analysis across the eight rings returned a value of 0.109, indicating a weak but positive spatial association between built-up area and population density in adjacent zones.
The ring-by-ring results reveal an unexpected geography. Built-up area peaks in the middle rings, reaching a maximum of 11.696 square kilometers in Ring 5, before declining toward the periphery. Population density, however, climbs continuously outward, hitting its highest value of 6,168 persons per square kilometer in Ring 8. This divergence, in which the outskirts hold more people on less developed land, is a signature of peripheral densification and helps explain the modest Moran’s I value. It suggests that in rapidly urbanizing Indian cities, land consumption expands outward first, and population growth intensifies in peripheral settlements later, often outpacing infrastructure and services. The road-offset analysis reinforced the corridor effect: the land requirement was largest in the offset closest to the major roads, indicating sprawling, less compact development there, while the third offset showed more concentrated built-up development despite still containing substantial vegetation and open land.
To translate these patterns into a planning metric, the study turned to the Urban and Regional Development Plans Formulation and Implementation guidelines issued by the Government of India. Residential land need was computed as 40 percent of existing urban built-up cover, then refined zone by zone using a formula that multiplies average population density in each ring or offset by the ratio of average plot size, set at 90 square meters, to average household size, set at 4.5 persons. Subtracting existing residential land from this requirement produced the area difference for each zone. The deficits ranged from 29.4 to 41.68 percent, with Ring 8, the outermost ring, showing the largest gap and Ring 3 the smallest. In other words, the places absorbing the most new residents are precisely the places with the deepest shortfall of legally planned residential land.
The implications extend well beyond Lucknow. The study argues that the largest disparities cluster around the Central Business District and along major roads, meaning that regulating sprawl in these corridors should be a top priority before their ecological value is irreversibly lost. Among the recommendations are strengthened zoning regulations, dedicated green belts and ecological conservation zones, formally delimited urban growth boundaries to encourage compact development, and density-based strategies such as transit-oriented development along transportation corridors. The paper also calls for regular remote-sensing-based monitoring of land-cover change so that policy can respond to growth in near real time, and for participatory planning that involves local communities alongside administrators.
For a city of 4.59 million people as of the 2011 Census, growing at the intersection of demographic pressure and climate stress, the message of this research is stark: unplanned expansion is not merely an aesthetic problem but a quantifiable deficit that can be measured, mapped, and managed. By fusing satellite pixels with census numbers and national planning norms, the study offers a replicable template for any rapidly urbanizing city that needs to know, in square kilometers, exactly how far its land supply falls short of its people’s needs.
Subject of Research: Proximity-based assessment of residential land requirements for urban expansion in Lucknow, India
Article Title: Proximity-based assessment of land requirements for urban expansion in Lucknow, India
Article References: Mishra, G. K. (2026). Proximity-based assessment of land requirements for urban expansion in Lucknow, India. Discover Geoscience, 4(1), Article 343. https://doi.org/10.1007/s44288-026-00711-2
Image Credits: AI Generated
DOI: 10.1007/s44288-026-00711-2
Keywords: urban sprawl, Lucknow, land use land cover, remote sensing, GIS, Landsat, population density, Global Human Settlement Layer, URDPFI guidelines, spatial analysis, sustainable urban planning, India
Cite Scienmag News
Violet Maxwell. (October 4, 2026). How Far From the City Center? Satellite Rings Reveal Lucknow’s Hidden Land Deficit. Scienmag. https://scienmag.com/how-far-from-the-city-center-satellite-rings-reveal-lucknows-hidden-land-deficit/
Violet Maxwell. "How Far From the City Center? Satellite Rings Reveal Lucknow’s Hidden Land Deficit." Scienmag, 4 October 2026, https://scienmag.com/how-far-from-the-city-center-satellite-rings-reveal-lucknows-hidden-land-deficit/. Accessed 4 October 2026.
Violet Maxwell. "How Far From the City Center? Satellite Rings Reveal Lucknow’s Hidden Land Deficit." Scienmag. October 4, 2026. https://scienmag.com/how-far-from-the-city-center-satellite-rings-reveal-lucknows-hidden-land-deficit/


