


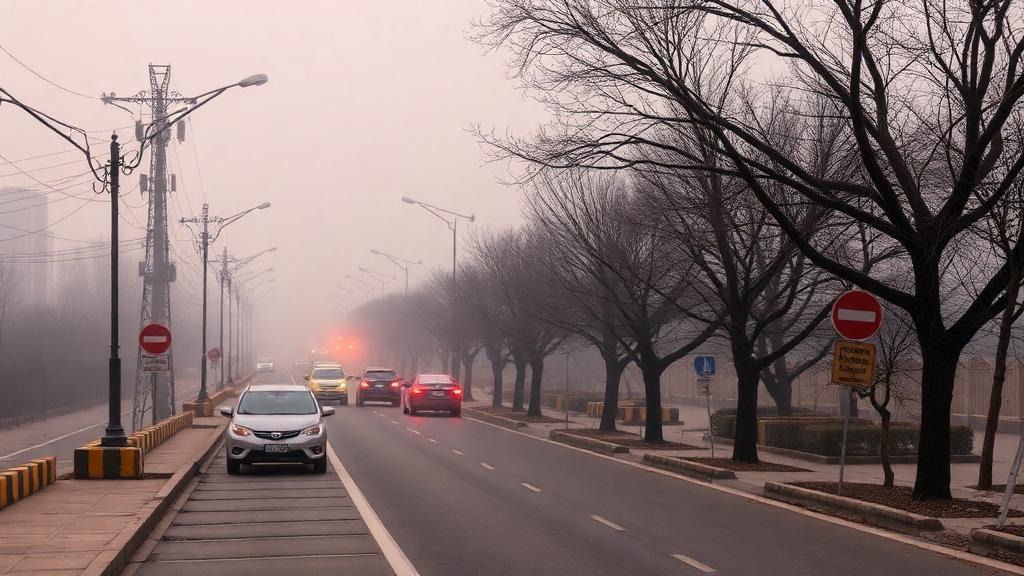
The air we breathe may be quietly reshaping one of the world’s fastest-growing epidemics. A sweeping new systematic review and meta-analysis, published in the journal Air Quality, Atmosphere & Health, has pooled evidence from 59 observational studies conducted across Asia, Europe, and the Americas to quantify how long-term exposure to ambient air pollution influences both the prevalence and incidence of type 2 diabetes mellitus (T2DM). The verdict is stark: fine particulate matter, nitrogen dioxide, and coarse particulate matter are all significantly associated with higher diabetes risk, and the burden falls hardest on older adults and populations in Asia, where the air is dirtiest.
The scale of the underlying problem is enormous. According to the International Diabetes Federation figures cited by the researchers, roughly 589 million adults aged 20 to 79 currently live with diabetes, a number projected to climb to 853 million by 2050 without stronger prevention. Type 2 diabetes accounts for more than 90 percent of all cases and drains at least one trillion US dollars in health expenditure each year. While ageing, obesity, urbanization, and poor diet remain the classic drivers, the geographic distribution of the disease has never been fully explained by these factors alone. The Middle East and North Africa record the highest age-standardized prevalence at 19.9 percent, while Africa sits at just 5.0 percent, and the new study argues that environmental exposures may help fill that explanatory gap.
To make the evidence comparable across dozens of heterogeneous studies, the research team standardized every effect estimate to a 10 microgram per cubic meter increase in pollutant concentration, rescaling results reported per interquartile range, per standard deviation, or per single microgram using log-linear conversion. They pooled odds ratios for prevalence from cross-sectional studies and hazard ratios for incidence from prospective cohort studies using random-effects models with inverse variance weighting. Between-study heterogeneity was quantified with the I-squared statistic, publication bias was probed with funnel plots and Egger’s regression test, and robustness was tested by sequentially excluding each study. Methodological quality was high across the board: nearly 79 percent of cross-sectional studies rated well on the AXIS tool, and more than 70 percent of cohort studies scored the maximum nine on the Newcastle-Ottawa Scale.
The headline finding concerns PM2.5, the microscopic particles less than 2.5 micrometers across that penetrate deep into the lungs and bloodstream. Across 14 cross-sectional studies, each 10 microgram per cubic meter rise in PM2.5 was associated with an 8 percent increase in the odds of T2DM prevalence (OR 1.08, 95 percent CI 1.06 to 1.11). The picture for new-onset disease was even more dramatic: pooled hazard ratios from cohort analyses reached 1.42 in key sensitivity analyses (95 percent CI 1.31 to 1.55), meaning people breathing higher concentrations developed diabetes at substantially higher rates. Subgroup analyses revealed the strongest incidence association in Asia, where the hazard ratio climbed to 1.65, compared with 1.35 in Europe and 1.16 in the Americas. PM2.5 was the most frequently studied pollutant, appearing in 45 of the 59 included studies, and it emerged as the most consistent signal in the entire analysis.
Nitrogen dioxide, a traffic-related gas, told a similarly troubling story. Nine studies of prevalence yielded a pooled odds ratio of 1.27 (95 percent CI 1.15 to 1.40), while twelve cohort studies produced a hazard ratio of 1.16 (95 percent CI 1.09 to 1.23) for incidence. Notably, the strongest prevalence association appeared in the Americas, where two studies produced a remarkably homogeneous pooled odds ratio of 1.53 with zero heterogeneity. PM10, the coarser particulate fraction, was associated with a 9 percent higher prevalence odds and, in some pooled analyses, a hazard ratio for incidence as high as 1.79, although that estimate carried extreme heterogeneity and widened considerably under sensitivity testing. Ozone behaved differently: it was significantly linked to diabetes incidence (HR 1.06, 95 percent CI 1.01 to 1.12) but not to prevalence (OR 1.03, 95 percent CI 0.99 to 1.08), a pattern the authors interpret as less consistent evidence requiring further study.
Why would inhaled pollutants damage the pancreas and disrupt blood sugar control? The biological plausibility rests on interconnected inflammatory, metabolic, and vascular pathways. Inhaled particulates and gases promote the generation of reactive oxygen species, triggering oxidative stress and activating inflammatory cascades. The resulting release of pro-inflammatory mediators drives chronic systemic inflammation, which impairs insulin signaling and glucose uptake in target tissues and raises insulin resistance. Persistent oxidative stress can also damage pancreatic beta cells, eroding the body’s capacity to secrete insulin, while endothelial dysfunction further disrupts glucose metabolism. Recent proteomic evidence cited in the review suggests that inflammation-related proteins may mediate part of the pollution-diabetes link, giving the epidemiological associations a concrete molecular footing.
What sets this analysis apart is its second layer: a cross-country comparison of the environmental, socioeconomic, and healthcare contexts in which the included studies were conducted. The researchers compiled indicators such as the Environmental Performance Index, the Global Food Security Index, education indices, per capita health expenditure, diabetes treatment coverage, walkability, greenness, obesity, and physical inactivity for every country represented in the review, then normalized them within each region for radar-plot comparison. The patterns were striking. European countries generally performed strongly on environmental and food security metrics, while Asian countries showed the widest variability, with Japan topping the regional indices alongside a low diabetes rate of 6.4 percent, and India and Indonesia showing prevalence of 22.6 percent and 12.8 percent respectively alongside weaker contextual scores. In the Americas, Canada combined the region’s best environmental performance with its lowest diabetes prevalence, while the United States recorded 12.5 percent prevalence and the region’s highest obesity rate at 42.7 percent.
The statistical correlations sharpened the story further. Spearman rank analysis revealed a strong inverse correlation between the Environmental Performance Index and diabetes prevalence (rho of minus 0.742), with similar inverse relationships for food security (minus 0.703), education (minus 0.598), health expenditure (minus 0.569), treatment coverage (minus 0.509), and walkability (minus 0.485). Conversely, national PM2.5 concentrations correlated positively with diabetes prevalence (rho 0.655). Crucially, these associations survived partial correlation analysis that adjusted for obesity and physical inactivity, and a leave-one-country-out sensitivity analysis confirmed that no single nation was driving the results. The air quality data reinforced the regional gradient: Asia’s median annual PM2.5 concentration of 24.6 micrograms per cubic meter dwarfed Europe’s 11.1 and North America’s 9.0, and every region exceeded the World Health Organization’s annual guideline of 5 micrograms per cubic meter, with Asia’s exceedance the most severe.
The authors are careful to flag the limits of these comparisons. The country-level correlations are ecological, meaning they describe aggregated populations rather than individuals and are vulnerable to the ecological fallacy; they should be read as exploratory and hypothesis-generating rather than causal. Heterogeneity in the meta-analyses was often extreme, with I-squared values exceeding 95 percent in several incidence analyses, reflecting genuine variation in exposure assessment methods, covariate adjustment, and study populations. Gender-stratified pooling was impossible because almost no studies reported sex-specific estimates, and entire regions, including much of Africa, parts of the Middle East, and several Southern Hemisphere countries, were absent from the literature altogether. Indoor air pollution, another plausible contributor, could not be assessed for lack of eligible studies.
Even with those caveats, the policy implications are hard to ignore. The findings argue for treating air quality management as a pillar of diabetes prevention: tighter emissions standards for traffic and industry, low-emission zones, expanded clean public transit, and incentives for renewable energy would all reduce the long-term exposures most consistently linked to the disease. Urban design matters too, given the inverse correlations between walkability, greenness, and diabetes prevalence at the country level. Health systems in highly polluted regions could integrate environmental exposure into screening programs, targeting older adults who showed the strongest susceptibility in the subgroup analyses. With diabetes cases projected to surge by hundreds of millions in the coming decades, the message of this analysis is that cleaning the air is not merely an environmental goal; it may be one of the most underappreciated tools in the global fight against type 2 diabetes.
Subject of Research: Association between ambient air pollution exposure and type 2 diabetes prevalence and incidence
Article Title: Ambient air pollution and type 2 diabetes mellitus: an updated global systematic review, meta-analysis, and cross-country comparative analysis
Article References: Ahmadi, F., Karimi, M., Nazari, R., & Nikoo, M. R. (2026). Ambient air pollution and type 2 diabetes mellitus: an updated global systematic review, meta-analysis, and cross-country comparative analysis. Air Quality, Atmosphere & Health, 19(10), Article 222. https://doi.org/10.1007/s11869-026-02114-1
Image Credits: AI Generated
DOI: 10.1007/s11869-026-02114-1
Keywords: air pollution, type 2 diabetes, PM2.5, nitrogen dioxide, meta-analysis, systematic review, insulin resistance, oxidative stress, public health, environmental performance, urban planning, global health
Cite Scienmag News
Russell Cooper. (October 1, 2026). Dirty Air, Rising Diabetes: Global Analysis Links Pollution to Type 2 Diabetes Risk. Scienmag. https://scienmag.com/dirty-air-rising-diabetes-global-analysis-links-pollution-to-type-2-diabetes-risk/
Russell Cooper. "Dirty Air, Rising Diabetes: Global Analysis Links Pollution to Type 2 Diabetes Risk." Scienmag, 1 October 2026, https://scienmag.com/dirty-air-rising-diabetes-global-analysis-links-pollution-to-type-2-diabetes-risk/. Accessed 1 October 2026.
Russell Cooper. "Dirty Air, Rising Diabetes: Global Analysis Links Pollution to Type 2 Diabetes Risk." Scienmag. October 1, 2026. https://scienmag.com/dirty-air-rising-diabetes-global-analysis-links-pollution-to-type-2-diabetes-risk/


