


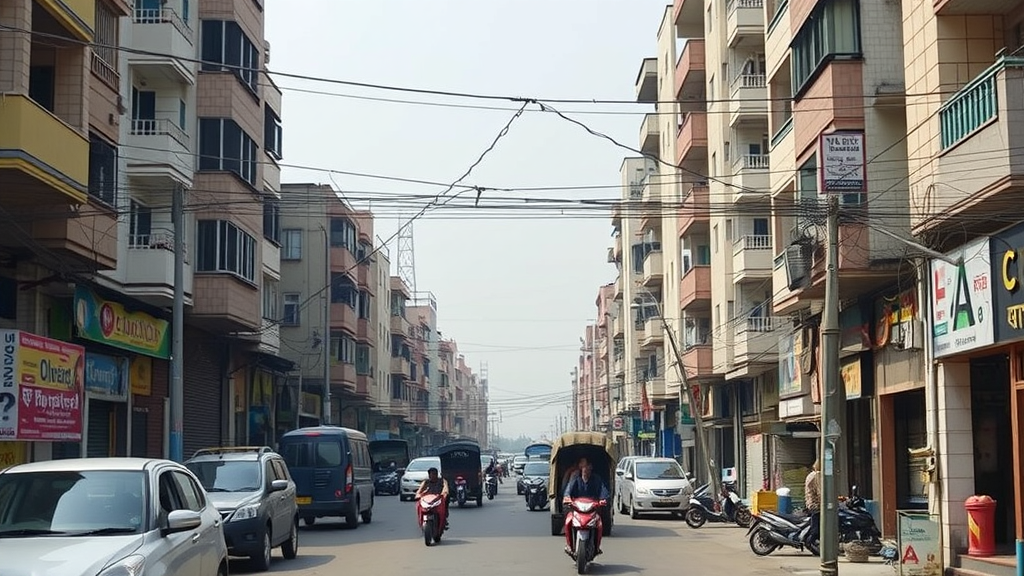
Kolkata is getting hotter in a way that satellite maps alone can no longer fully explain. A new study of the Kolkata Metropolitan Area, published in Discover Cities, has tracked how the city’s built landscape transformed between 2010 and 2023, and then asked residents how that transformation actually feels in their bodies. The answer is sobering: as compact mid-rise apartment blocks and dense low-rise neighborhoods have swallowed gardens, wetlands, and farmland, the surface of the metropolis has warmed, and the health complaints of ordinary people have shifted from vague, generalized discomfort to sharply defined symptoms tied to specific kinds of urban fabric.
The research team, led by geographers at Adamas University in West Bengal, used the Local Climate Zone (LCZ) framework, a classification scheme introduced by urban climatologists Ian Stewart and Tim Oke in 2012. Instead of treating a city as a single hot mass, the LCZ scheme divides it into zones of uniform surface cover, structure, material, and human activity, spanning hundreds of meters to several kilometers. Compact high-rise districts, lightweight slum housing, heavy industry, dense tree cover, and low agricultural plants each form distinct zones with their own thermal signatures. This matters because the urban heat island effect, first noticed by Luke Howard in London in the 1810s, is not uniform: it is the product of street geometry, building height, impervious surfaces, and the slow disappearance of vegetation that shades and cools.
To map these zones, the researchers turned to the free Landsat satellite archive, downloading every available scene from 2010, 2015, 2020, and 2023 with less than ten percent cloud cover. Land surface temperature was retrieved using a single-channel algorithm for Landsat 5 and a split-window method for Landsat 8, both executed in Google Earth Engine. The LCZ classification itself was performed in the open-source SAGA-GIS platform using a supervised Random Forest classifier trained on carefully refined sample polygons drawn from high-resolution Google Earth imagery, following the WUDAPT Level 0 protocol. Landsat scenes were resampled from 30 meters to a 100-meter grid, the scale at which local urban structure is best represented, and majority filtering removed isolated pixels to produce morphologically coherent zones.
The classification proved robust. Kappa coefficients ranged from 0.8367 in 2010 to 0.8462 in 2023, with overall accuracy between 83 and 84 percent in every year. The team went further than most satellite studies by validating the maps on the ground: they captured fisheye photographs of the sky at breast height across six sampled locations, from the planned avenues of Kalyani to the congested lanes of the Kolkata Municipal Corporation area. By converting these images to black and white, separating sky pixels from building, road, and tree pixels, and computing the ratio of open sky to the full circular image, they derived Sky View Factors for each site. The measured values matched the documented morphology of the assigned LCZ classes, confirming that the satellite-derived zones reflect real street-canyon geometry, which governs how much solar radiation reaches the ground and how much longwave radiation escapes at night.
The temporal picture is stark. In 2010, building-type zones covered roughly 40 percent of the metropolitan area while vegetated zones held 53 percent. By 2020 the balance had tipped, with built forms at 52 percent and vegetation down to 41 percent. By 2023, built-up classes dominated at 66.37 percent of the total area, and vegetated classes had collapsed to just 12.45 percent. The city has not merely spread; it has compacted. Open high-rise and open mid-rise forms were converted into compact mid-rise (LCZ 2) and compact low-rise (LCZ 3) fabric, signaling both vertical growth and densification. Mean centers of the zone distributions reveal the direction of change: compact high-rise and mid-rise zones shifted southward toward Sonarpur Rajpur, where scarce land pushed developers toward gated high-rise apartments, while most other built classes expanded northward and northeastward into Barasat, Barrackpore, and Kamarhati, where open land remained. The southward retreat of dense trees, scattered trees, scrub, and low plants marks the loss of green and agricultural land in the north.
Land surface temperatures rose accordingly. The annual mean climbed from about 21.99 degrees Celsius in the late reference period to 23.25 degrees Celsius in 2023, and the Landsat retrievals correlated strongly (r = 0.80) with the MODIS Terra daily temperature product, lending independent credibility to the estimates. When the researchers computed heat island intensity, the difference between each built zone’s mean temperature and that of low plants (LCZ D), the rural reference, three classes stood out: lightweight low-rise (LCZ 7), large low-rise (LCZ 8), and heavy industry (LCZ 10). These zones, home to low-cost slum housing and the jute, textile, and chemical industries along the Hooghly River belt, consistently showed the strongest and most persistent surface heat island signatures across all four study years.
But temperatures on a map do not sweat. To capture the human dimension, the team surveyed 715 adults across 28 municipalities in March to May 2023, using stratified random sampling across all nine building-type LCZs. Every respondent reported at least one hour of daily outdoor sun exposure, divided into four bands from one to three hours up to ten to twelve hours. The questionnaire catalogued 28 heat-induced discomforts, from headaches and heavy sweating to dizziness, excessive thirst, blurred vision, skin rashes, back pain, muscle pain, and even seizures. Geocoding each residence and overlaying the points on the 100-meter LCZ map linked every report to a specific urban morphology. A heat map of relative frequencies showed that ten symptoms were moderate to highly frequent regardless of exposure time, with headache and heavy sweating dominant everywhere, and that the probability of nearly every discomfort rose steadily as hours in the sun increased.
The most technically innovative step was a correspondence analysis linking LCZ classes to reported symptoms for each exposure band, tested with chi-square statistics that were significant at p < 0.001 for all four durations. The pattern changed with time. During one-to-three-hour exposure, the associations were noisy: lightweight low-rise zones and large low-rise zones appeared as outliers, and symptoms clustered loosely without clear zone-specific links. As exposure lengthened, the structure sharpened. Total inertia, a measure of how differentiated the zone-symptom relationships are, rose from 0.215 for short exposure to 0.584 for ten-to-twelve-hour exposure, while the first two dimensions explained up to 76.5 percent of the variance. By the longest exposure band, specific pairings emerged: heavy sweating with compact low-rise zones, heat stroke with compact high-rise, suffocation with compact high-rise and mid-rise, and headache and back pain with open mid-rise and heavy industrial zones. Prolonged heat, in other words, converts generalized misery into a predictable geography of illness.
The implications reach well beyond Kolkata. The findings align with LCZ studies in Hamburg, Nanjing, and central European cities showing that densification raises surface temperatures, but they add something most such studies lack: empirical, field-based evidence of who suffers and how. Because lightweight low-rise settlements and industrial belts combine the highest temperatures with some of the city’s most vulnerable residents, the study exposes a socio-spatial dimension of urban warming, where those least able to afford cooling bear the greatest thermal burden. The authors note that the zones shifting northward and northeastward, including open mid-rise, open low-rise, lightweight low-rise, and industrial classes, deserve priority planning attention, and they point to artificial intelligence, green infrastructure, and reflective surfaces as tools for predictive modeling and mitigation aligned with the Sustainable Development Goals on sustainable cities, climate action, and health.
What makes this research resonate is its refusal to separate climate science from lived experience. A city that loses two-fifths of its vegetation in thirteen years does not just warm statistically; its residents report more headaches, more dizziness, more thirst, and more dangerous symptoms as their hours outdoors lengthen. The lesson for rapidly urbanizing tropical cities is that urban form is health policy. Every compact mid-rise tower raised on a former wetland, every tree line cleared for a road, quietly rewrites the thermal contract between a city and the people who walk its streets, and the new study gives planners a framework, validated from orbit down to the fisheye lens, for reading that contract before it is signed.
Subject of Research: Heat-induced health discomforts associated with changing local climate zones in the Kolkata Metropolitan Area, India
Article Title: Understanding the heat-induced discomforts associated with changing local climate zones in indian cities
Article References: Parial, M., Khorat, P., Mukherjee, K., Dash, P., Karmakar, S., Roy, A. D., Bhadra, T., Saha, A., & Dhali, B. (2026). Understanding the heat-induced discomforts associated with changing local climate zones in indian cities. Discover Cities, 3(1), Article 190. https://doi.org/10.1007/s44327-026-00288-y
Image Credits: AI Generated
DOI: 10.1007/s44327-026-00288-y
Keywords: urban heat island, local climate zones, Kolkata, land surface temperature, remote sensing, sky view factor, urban morphology, heat stress, public health, correspondence analysis, urbanization, West Bengal
Cite Scienmag News
Courtney Benton. (September 23, 2026). How Kolkata’s Changing Urban Form Is Turning Everyday Heat Into a Health Hazard. Scienmag. https://scienmag.com/how-kolkatas-changing-urban-form-is-turning-everyday-heat-into-a-health-hazard/
Courtney Benton. "How Kolkata’s Changing Urban Form Is Turning Everyday Heat Into a Health Hazard." Scienmag, 23 September 2026, https://scienmag.com/how-kolkatas-changing-urban-form-is-turning-everyday-heat-into-a-health-hazard/. Accessed 23 September 2026.
Courtney Benton. "How Kolkata’s Changing Urban Form Is Turning Everyday Heat Into a Health Hazard." Scienmag. September 23, 2026. https://scienmag.com/how-kolkatas-changing-urban-form-is-turning-everyday-heat-into-a-health-hazard/


