


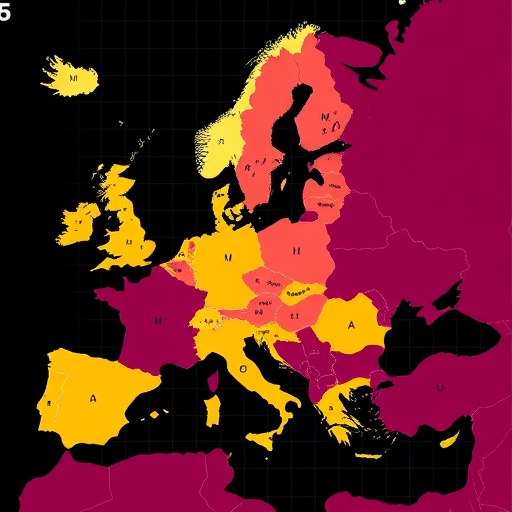
Mathematics achievement has long been framed as a contest between two kinds of forces: the material circumstances of a student’s family and the emotional landscape that student carries into the classroom. A new study published in Large-scale Assessments in Education argues that this framing is too simple. By combining machine learning with latent profile analysis across PISA 2022 data from nine European countries, Ömer Doğan of Uşak University shows that socioeconomic resources and mathematics-related affective beliefs act not as separate levers but as interacting ingredients that combine into distinct student “types” — and that these types are far from evenly distributed across schools.
The research draws on the OECD’s Programme for International Student Assessment, the 2022 cycle of which tested approximately 690,000 students in 81 countries and economies, with mathematics as the major domain. From the released database of 613,744 student records, Doğan purposively selected nine European systems spanning three performance bands: Estonia (510), the Netherlands (493) and Poland (489) in the higher band; Germany (475), France (474) and Portugal (472) in the middle band; and Moldova (414), North Macedonia (389) and Albania (368) in the lower band. This banded design ensured that the analysis captured the full range of national mathematics performance rather than clustering around Europe’s elite systems.
The methodological architecture of the study is its most striking feature. Rather than choosing between prediction-oriented machine learning and person-centred latent variable modelling, Doğan welded the two together. Four algorithm families competed to predict mathematics scores: two regularised linear models, Ridge and LASSO regression, which assume additive linear relationships, and two gradient-boosted decision-tree ensembles, XGBoost and LightGBM, which can capture non-linear effects and interactions without being told where to look. Crucially, the data were split at the school level — 44,404 students in the training set, 5,750 in the test set and 5,948 in a holdout set examined only once — so that students from the same school never appeared in different subsets. This design prevents data leakage, the subtle form of optimistic bias that arises when models are evaluated on cases too similar to those they were trained on.
The verdict of the algorithm bake-off was unambiguous. Ridge and LASSO each explained roughly 51 percent of the variance in mathematics scores, while XGBoost and LightGBM reached 57 to 58 percent, cutting prediction error by five to seven points on the RMSE scale. This advantage held stably across all ten plausible values — the multiple imputed scores the OECD generates for each student — and across both the test and holdout sets. The takeaway is substantive as much as technical: the relationships linking socioeconomic conditions, emotions and achievement are not well described as straight lines added together. Non-linearities and interactions appear to be baked into the fabric of educational data, and flexible learners detect structure that a regularised linear specification simply cannot.
To identify which variables carried the most signal, the study used gain-based feature importance from LightGBM, cross-checked against XGBoost, and took the intersection of the two rankings. The consensus list of the top 15 predictors was dominated by socioeconomic indicators such as home possessions (HOMEPOS) and the ESCS index of economic, social and cultural status, alongside mathematics-specific affective measures — most prominently mathematics self-efficacy (MATHEFF) and mathematics anxiety (ANXMAT). Family support for self-directed learning and subjective familiarity with mathematics concepts also ranked highly. Notably, three school-level indicators of institutional climate — instructional leadership, teacher participation in school decisions, and school actions to sustain learning during COVID-19 closures — made the top 15, providing the empirical warrant for the multilevel analysis that followed. Because these indices are correlated, their importance should be read as the joint relevance of broader domains rather than as separable, independent effects.
With the key variables identified, the study turned to latent profile analysis, a technique that classifies individuals into unobserved subgroups based on the configuration of characteristics they share. Applied to the twelve strongest student-level indicators, the analysis supported a six-profile solution, selected on the Bayesian Information Criterion. The profiles span a remarkable spectrum. The most prevalent type, found in 31.5 percent of students, combines resource-rich backgrounds with confidence and low anxiety. At the other end sits a profile defined by high anxiety and low self-efficacy and support, accounting for 15 percent. Perhaps most intriguing is a smaller profile in which high creativity and ICT engagement co-occur with socioeconomic disadvantage — a configuration that challenges any simple deficit model of poverty — and an even smaller, exploratory group of roughly three percent for whom extreme creative-digital engagement occurs at broadly average socioeconomic status.
The stakes of these configurations became concrete when achievement was mapped onto them. The gap between the highest-performing and lowest-performing profiles exceeded 125 PISA points — more than two average OECD proficiency levels — and the hierarchical ordering of profiles was perfectly preserved across the training, test and holdout sets. All six profiles appeared in every country, confirming that the structure is not an artefact of any single national context. Yet prevalence varied dramatically with national performance: the creative, lower-SES profile accounted for 39.2 percent of students in Albania and 27.8 percent in Moldova but only around five percent in Estonia and the Netherlands, while the resource-rich, confident profile ranged from over 50 percent in the Netherlands down to 7.4 percent in Albania. The high-anxiety profile, tellingly, was most common in higher-performing Poland and least common in Albania, suggesting that anxiety’s geography does not simply mirror national achievement.
The study’s final analytical layer asked whether student types cluster within particular kinds of schools. A separate latent profile analysis of the three school-level indicators produced a “moderate” mainstream profile containing about 98 percent of schools, plus two rare outliers: a “teacher-led” type marked by unusually high teacher participation in decisions, and a “learning-continuity support” type characterised by extensive school actions to maintain learning during pandemic closures. Mixed-effects logistic regression — modelling the odds of each student profile as a function of school profile, with a random intercept for school nesting — found that student types were indeed non-randomly distributed. Learning-continuity schools were strongly associated with hosting creative, lower-SES students (an unadjusted odds ratio of 7.30), and were strikingly unlikely to contain the advantaged, low-anxiety profile at all.
Here, however, the study exercises unusual honesty. Because the rare school profiles were concentrated in a handful of countries, Doğan re-estimated the models with country as a fixed effect. Most associations attenuated sharply and lost significance; only the link between learning-continuity schools and the creative, lower-SES profile survived, dropping to an odds ratio of 2.21 but remaining statistically significant. The school-level findings, the paper concludes, are best read as country-confounded descriptive patterns rather than independent effects of school climate, and the cross-sectional design cannot distinguish whether school climates shape student types or simply attract them.
A final test asked whether the profiles improved prediction when added back into the models as categorical features. They barely did — a small gain for the linear models and essentially nothing for XGBoost. This, Doğan notes, is expected rather than disappointing: the profiles were built from variables already among the strongest predictors, so their information was already in the feature set. Their value lies in interpretation, not prediction. Where a variable-centred model says that anxiety and socioeconomic status matter, the profile approach says what students look like when these forces combine — and points toward differentiated interventions, such as anxiety reduction for one group or talent development that harnesses creativity and digital strengths in another, instead of one-size-fits-all support.
The study’s limitations are laid out with unusual thoroughness. Measurement invariance of the affective scales across nine linguistically and culturally distinct countries was not formally tested, a gap that could mean some profiles partly reflect country-specific response patterns. Survey weights were used for descriptive statistics but not within the predictive or multilevel models. And with only nine countries, nation cannot be modelled as a random factor. Still, the study offers a replicable blueprint — prediction to find the signal, profiling to find the people, and multilevel modelling to find the context — and a clear policy message: tackling educational inequality requires attending simultaneously to the configurations students embody and to the institutional climates linked to their distribution.
Cite Scienmag News
Teresa Odom. (September 5, 2026). Machine learning reveals math achievement profiles across nine European countries. Scienmag. https://scienmag.com/machine-learning-reveals-math-achievement-profiles-across-nine-european-countries/
Teresa Odom. "Machine learning reveals math achievement profiles across nine European countries." Scienmag, 5 September 2026, https://scienmag.com/machine-learning-reveals-math-achievement-profiles-across-nine-european-countries/. Accessed 5 September 2026.
Teresa Odom. "Machine learning reveals math achievement profiles across nine European countries." Scienmag. September 5, 2026. https://scienmag.com/machine-learning-reveals-math-achievement-profiles-across-nine-european-countries/


