In a groundbreaking global assessment published in Nature Climate Change, researchers have unveiled the intricate landscape of greenhouse gas emissions stemming from cropland around the year 2020. This comprehensive study quantifies cropland emissions at 2.5 gigatonnes of CO₂ equivalent (GtCO₂e), underscoring their significant contribution as 4.2% of net anthropogenic emissions worldwide. Collectively, these cropland emissions account for nearly a fifth of all emissions within the agriculture, forestry, and other land use sector, revealing an often underappreciated driver of climate change.
The study meticulously dissects the heterogeneous emission profile of croplands, identifying three primary contributors: cultivated drained peatlands, rice paddies, and synthetic nitrogen fertilizers. Each of these sources contributes roughly a third or more of the total emissions, underscoring their outsized impact. Peatlands, mainly concentrated in northern latitudes and parts of Southeast Asia, emerge as hotspots due to their high carbon stores and the effects of drainage. Meanwhile, vast expanses of flooded rice fields across Asia release significant methane emissions, and the widespread application of synthetic nitrogen fertilizers in intensive agricultural systems boosts nitrous oxide emissions globally.
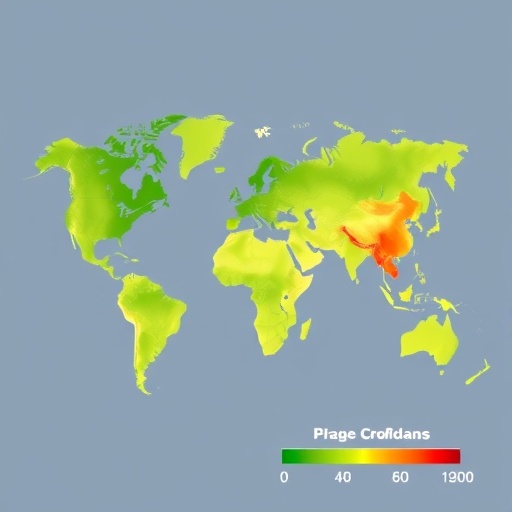
This spatially explicit mapping offers valuable insights into the geographic concentration and drivers behind cropland emissions, revealing stark regional disparities. In areas such as East Asia and parts of Latin America, intensified fertilizer use, increasing agricultural residues, and persistent cultivation on drained peatlands have propelled emissions upward over the past two decades. These findings highlight the necessity for regionally tailored mitigation strategies that acknowledge the varying agricultural practices, land types, and crop distributions across different parts of the globe.
Recognizing that one-size-fits-all solutions are unlikely to suffice, the researchers advocate for context-sensitive approaches to emission reduction. For example, rewetting drained peatlands represents a potent pathway to slash emissions substantially without compromising cropland area or productivity. Similarly, targeting methane emissions from rice paddies by moving away from continuous flooding and implementing straw removal can achieve emission reductions nearing 45%, presenting a win-win for climate and agriculture.
Complementing these strategies, agricultural management practices that optimize nitrogen fertilizer use are critical. The study underscores the potential of adopting the 4R nutrient stewardship framework—applying the right source of fertilizer at the right rate, time, and place—to enhance nitrogen use efficiency while curbing nitrous oxide emissions. Moreover, integrating biochar amendments, conservation tillage, and cover cropping into cropland cultivation can further improve soil health and reduce the carbon footprint of farming systems.
A key tension revealed by the analysis lies in the trade-off between agricultural productivity and emission intensity. Regions responsible for a large share of global calorie production, notably East Asia and the Pacific as well as South Asia, exhibit some of the highest emission intensities per hectare, reflecting their intense land use. Paradoxically, lower emission regions such as Sub-Saharan Africa and the Middle East suffer from comparatively poor productivity, leading to high emission intensities per calorie produced despite lower overall emissions.
Delving deeper, the study highlights how different crops contribute disproportionately to emissions relative to their caloric outputs. Rice alone accounts for 43% of global cropland emissions while providing 30% of caloric intake in Asia, highlighting its dual role as a vital food source and major methane emitter. Conversely, oil palm, a significant emitter ranked fourth in the study, emerges as a relatively land-efficient crop due to its high caloric yields. These dual perspectives emphasize the complex challenge of balancing emission reductions against global food security and underscore the pitfalls of broad-brush policies that may undermine productivity hotspots.
Methodologically, this research represents an unprecedented effort in integrating disparate data streams—ranging from national inventories and scientific literature to advanced remote sensing and spatially explicit datasets on fertilizer application, manure management, residue handling, and the mapping of rice paddies and peatlands. This synthesis achieved a harmonized global framework enabling emission estimation at granular, crop-specific, and pixel-level scales. Such resolution facilitates direct comparison of multiple emission sources across regions, revealing nuanced hotspots and informing localized mitigation efforts.
While this novel dataset aligns broadly with existing global emission inventories, the authors are frank about persistent limitations, notably the coarse resolution and inconsistencies prevailing in underlying input data. For instance, while national estimates of drained peatlands correspond well with those from the Global Peatland Assessment, increasingly localized field studies indicate critical spatial misalignments that could bias emission quantifications. These gaps underscore an urgent need for improved subnational and crop-specific data to enhance accuracy and reliability.
This scientific endeavor also interrogated the impact of methodological choices, comparing emission estimates derived from the IPCC’s 2006 guidelines with its 2019 refinement. Notably, the updated approach projected consistently reduced nitrous oxide emissions from both inorganic and organic nitrogen inputs, whereas methane emissions from rice paddies remained relatively stable across methods. Nevertheless, reliance on uniform emission factors—mandated under Tier 1 and 2 IPCC protocols—results in the oversimplification of inherently spatially variable processes, introducing potential biases in both under- and over-estimations at local scales.
To address these uncertainties, the team employed Monte Carlo simulations to propagate variations in emission factors, providing a probabilistic understanding of the data’s confidence intervals. However, the authors emphasize the necessity of integrating spatial heterogeneity directly into future models to more accurately reflect real-world complexities. Advanced approaches leveraging nonlinear regression, machine learning, and process-based modeling have shown promise in refining cropland emission estimates, though systematic cross-method validations remain outstanding.
The profound implications of this research extend beyond mere quantification. By elucidating dominant emission sources, identifying crop-level contributions, and spotlighting critical regional trade-offs between emissions and food production efficiency, this work lays a critical foundation for designing balanced and actionable climate mitigation strategies within agriculture. It advocates for harmonized methodologies, higher-resolution input data, and expanded systematic uncertainty analyses as key avenues to strengthen future agricultural greenhouse gas inventories.
Ultimately, this spatially explicit global assessment confronts policymakers and scientists with the nuanced reality that curbing cropland greenhouse gas emissions demands sophisticated, targeted interventions that safeguard both climate and food security. Blanket emission reductions risks undermining fragile agricultural productivity in emission hotspots, underscoring the imperative for smarter, evidence-based solutions. The study stands as a landmark contribution in reconciling the dual global goals of achieving climatic stability and feeding a growing population sustainably.
Subject of Research: Spatially explicit global assessment of cropland greenhouse gas emissions and their mitigation potential circa 2020.
Article Title: Spatially explicit global assessment of cropland greenhouse gas emissions circa 2020.
Article References:
Cao, P., Bilotto, F., Gonzalez Fischer, C. et al. Spatially explicit global assessment of cropland greenhouse gas emissions circa 2020. Nat. Clim. Chang. (2026). https://doi.org/10.1038/s41558-026-02558-4
Image Credits: AI Generated
DOI: https://doi.org/10.1038/s41558-026-02558-4
